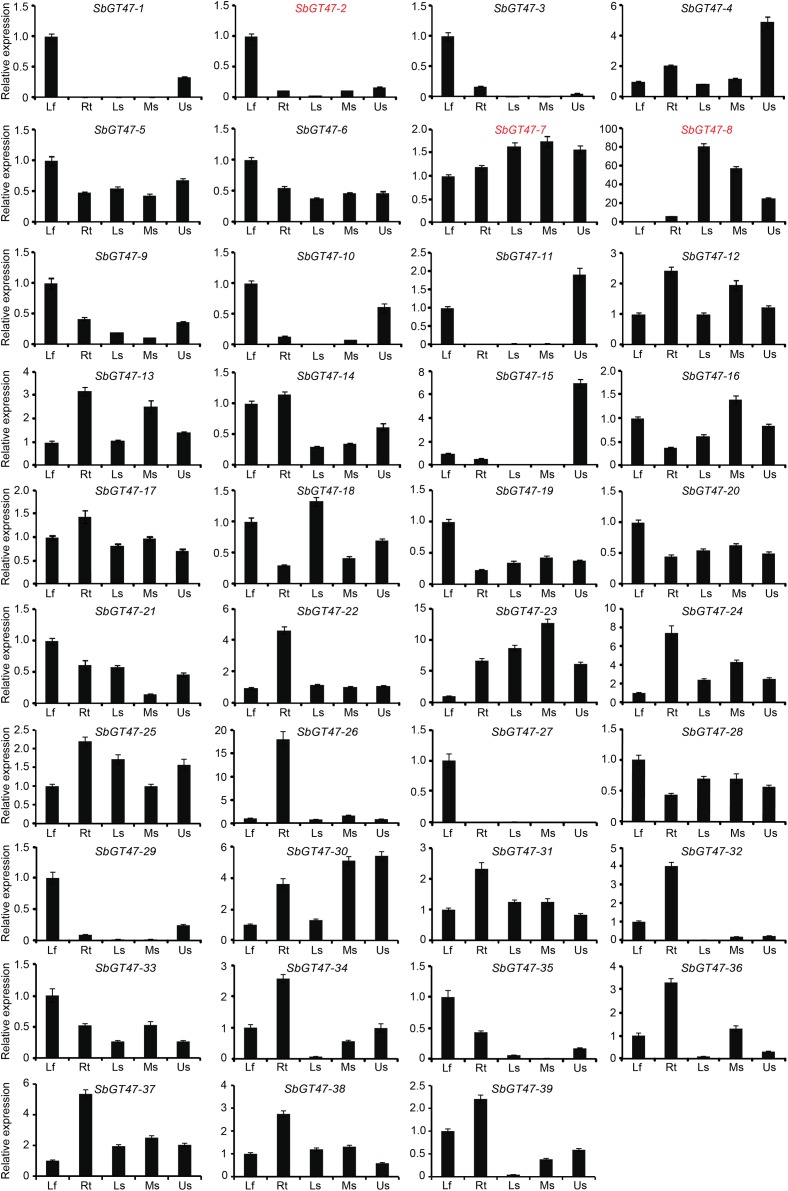
FIGURE 3.
Tissue expression profiles of sorghum GT47 genes detected by qRT-PCR. SbGT47_2, SbGT47_7, and SbGT47_8 marked with red were selected for subsequent analysis. Lf, leaves; Rt, roots; BS, basal stems; MS, middle stems; US, upper stems. SbACTIN2 was used as an internal control. Bar represents standard deviations (SD) from three biological repeats.

