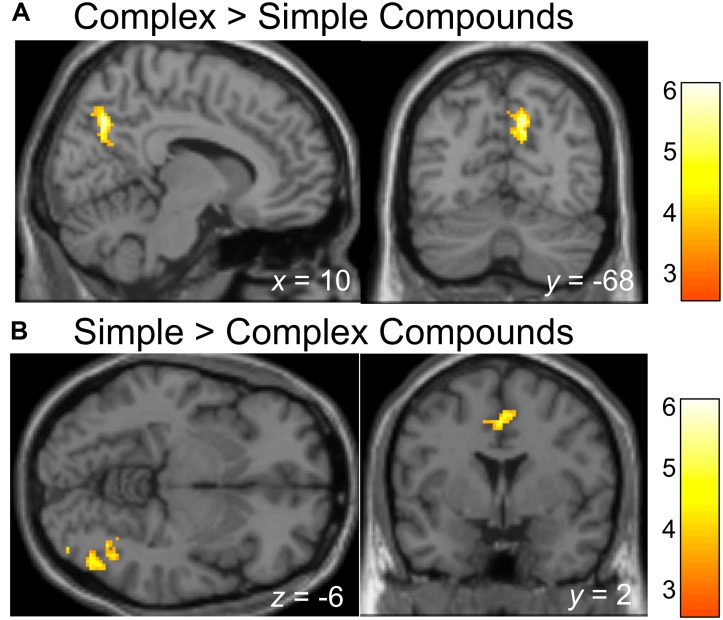
FIGURE 3.
Brain regions showing activation difference when processing Simple compared to Complex compounds. Activation maps are rendered on a brain template depicting regions showing higher activation during the processing of Complex compared to Simple Compounds (A), or higher activation during the processing of Simple compared to Complex Compounds (B). The threshold for depicting effects in activation map was set at p < 0.001 with 100 contiguous voxels.

