Figure 3.
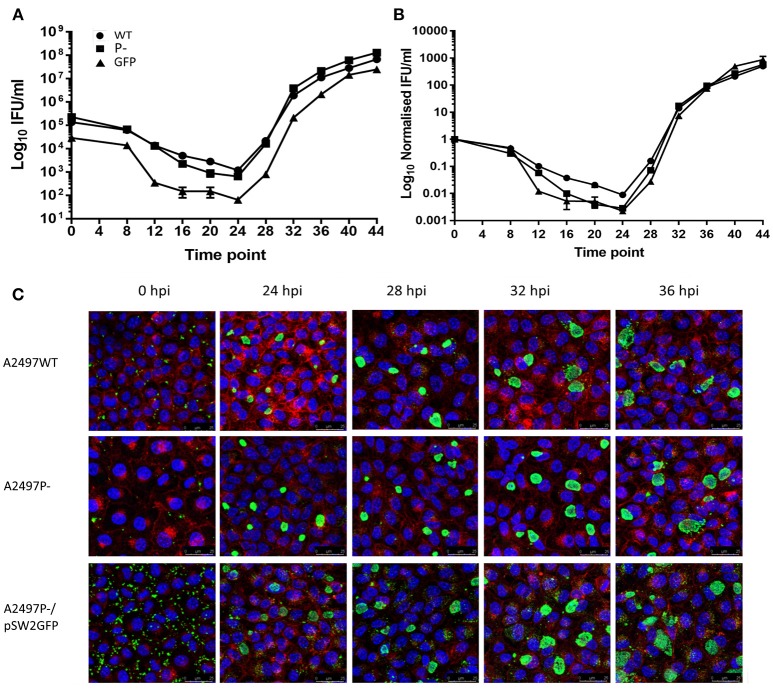
Growth curve analysis of C. trachomatis A2497 strains used in this study: wildtype (WT), plasmid cured (P-), and carrying the pSW2::GFP plasmid (GFP). (A) One-step infectivity assay; this is plotted on a log10 Y axis; (B) normalised infectivity assay. Here, the inclusion counts (IFUml-1) were normalised by dividing each value by the starting IFUml-1 to make all curves relative to 1 IFUml-1 for ease of comparison. (C) Confocal images of immunofluorescently stained inclusions at selected time points.

