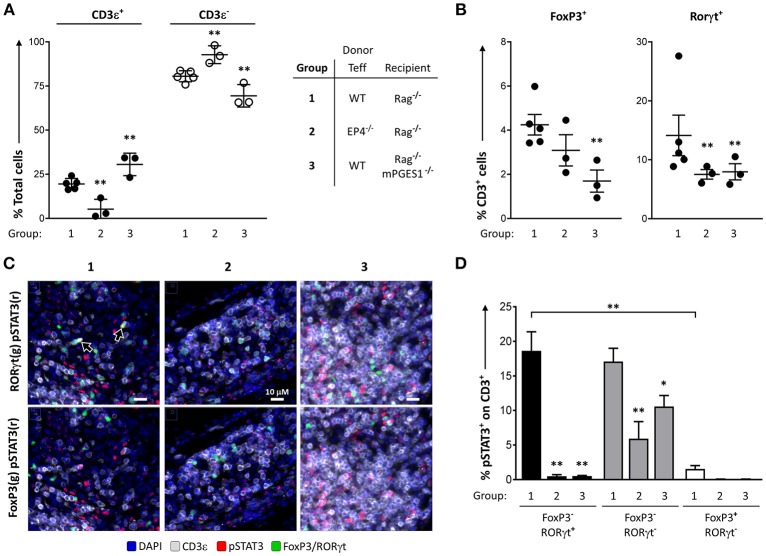
Figure 6.
PGE2 controls phosphorylation of STAT3 in colon-infiltrating T cells. Individual colons from the 3 different groups of colitic mice indicated (1 = WT Teff → Rag1−/−, 2 = EP4ΔCD4 Teff → Rag1−/−, 3 = WT Teff → Rag1−/− x mPGES-1−/−) were processed and stained for fluorescence microscopy evaluation DAPI, CD3ε, RORγt, FoxP3, and pSTAT3. (A) Quantification of total CD3ε+ and CD3ε− cells in 15 regions/colon containing a total of 15–30K cells. (B) Quantification of total CD3ε+FoxP3+ and CD3ε+RORγt+ cells in the same groups. (C) Representative colon sections depicting co-localization of RORγt (green), pSTAT3 (red) and CD3 (gray) in the upper row, or of FoxP3 (green), pSTAT3 (red) with CD3 (gray) in the lower row in the same 3 groups. (D) Summary of the quantification of pSTAT3+ cells within the indicated CD3ε+ subsets (single RORγt+, RORγt−FoxP3− or single FoxP3+). *P < 0.05 and **P < 0.01 using a one-way ANOVA with Welch's correction.

