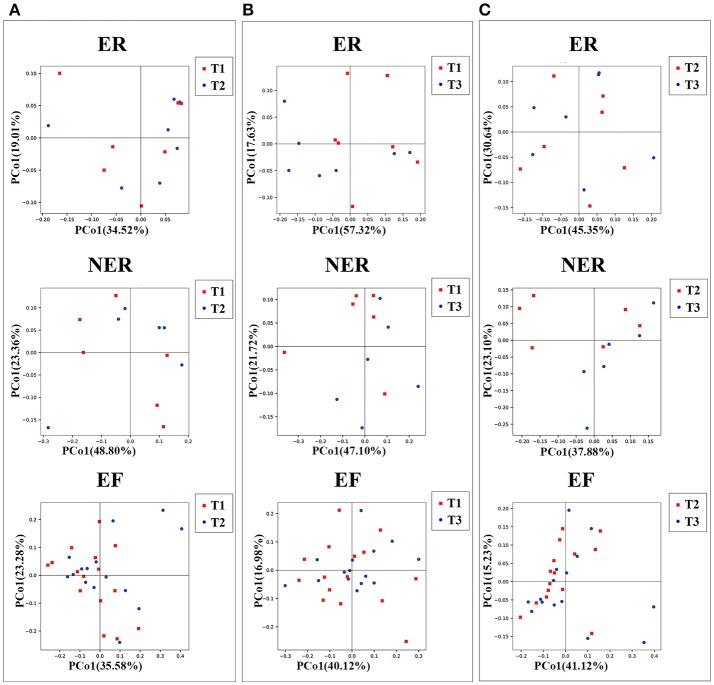
Figure 2.
(A) Principal coordinates analysis (PCoA) based on weighted UniFrac distance exhibiting the variation of microbiota community structure from T1 to T2 in the three groups. Each symbol represents one sample: red for T1, blue for T2. (B) PCoA based on weighted UniFrac distance exhibiting the variation of community structure from T1 to T3 in the three groups. Each symbol represents one sample: red for T1, blue for T3. (C) PCoA based on weighted UniFrac distance exhibiting the variation of community structure from T2 to T3 in the three groups. Each symbol represents one sample: red for T2, blue for T3.

