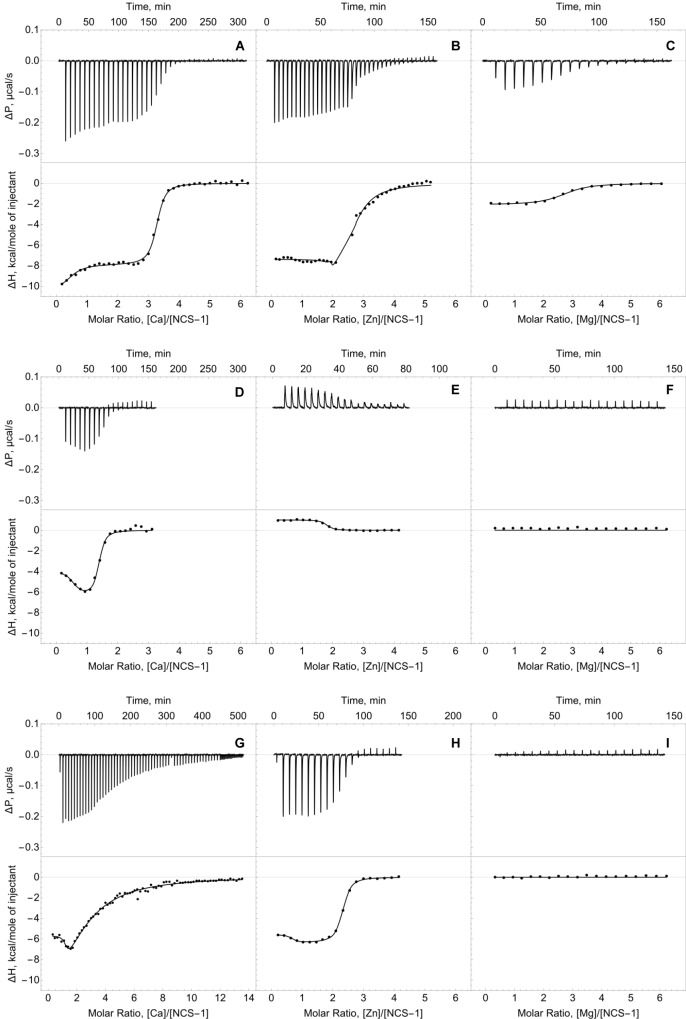
FIGURE 2.
Thermodynamics of calcium, zinc and magnesium binding to NCS-1. Typical ITC curves (upper panels) and binding isotherms (lower panels) representing titration of NCS-1 (25 μM) by different cations. (A) Binding of Ca2+. (B) Binding of Zn2+. (C) Binding of Mg2+. (D) Binding of Ca2+ in the presence of 250 μM Zn2+. (E) Binding of Zn2+ in the presence of 1 mM Ca2+. (F) Binding of Mg2+ in the presence of 250 μM Zn2+. (G) Binding of Ca2+ in the presence of 5 mM Mg2+. (H) Binding of Zn2+ in the presence of 5 mM Mg2+. (I) Binding of Mg2+ in the presence of 1 mM Ca2+. Best fits are shown as solid curves (see Table 1).

