FIGURE 8.
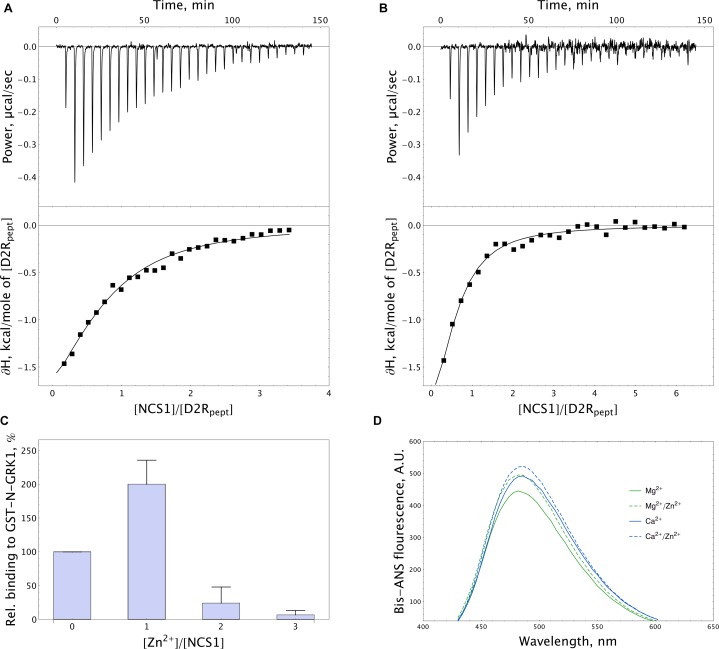
Target-binding properties of NCS-1 in the presence of zinc. (A,B) Typical ITC curves (upper panels) and binding isotherms (lower panels) representing titration of 50 μM D2R peptide with 5–150 μM NCS-1 in the presence of 5 mM Ca2+ (A) or 5 mM Ca2+ and 100 μM Zn2+ (B). (C) Binding of 25 μM NCS-1 to GST-N-GRK1 at 1 mM Ca2+ in the presence of 0, 25, 50, or 75 μM Zn2+ (i.e., at [Zn2+]/[NCS-1] ratio of 0-3), monitored by pull-down assay. (D) Representative fluorescence spectra of bis-ANS (1.2 μM) and NCS-1 (5 μM) complexes formed in the presence of either 1 mM Mg2+ or 100 μM Ca2+ with or without addition of 100 μM Zn2+.

