
Figure 7.
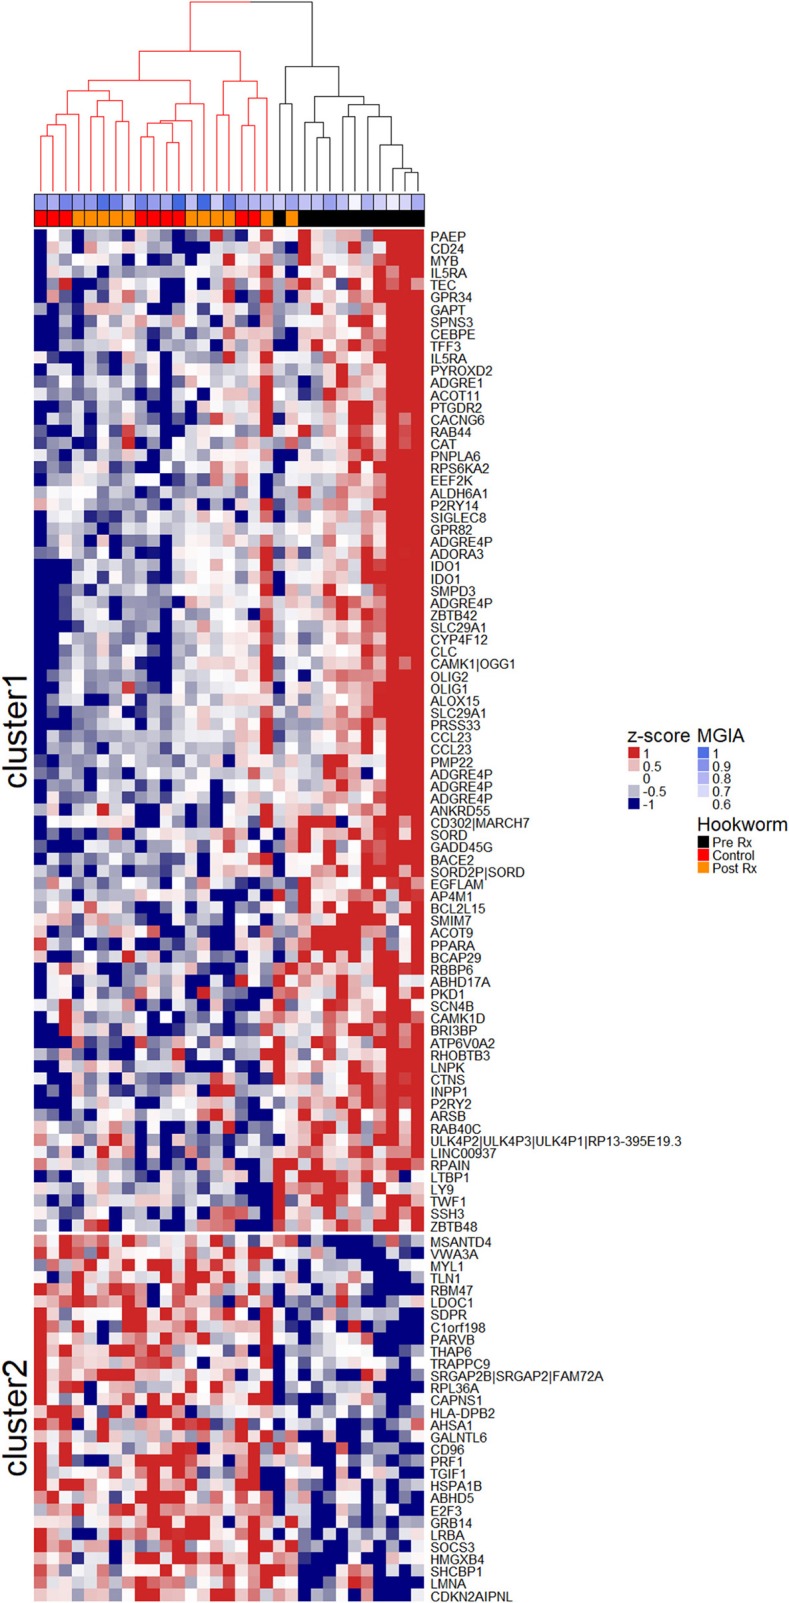
Unsupervised clustering of the hookworm-specific transcriptional signature reveals correlation to mycobacterial growth inhibition. Normalized expression values of 112 probes mapping to 104 genes were mean centered and scaled and columns were clustered using hierarchical clustering as described in the Materials and Methods. The two largest clusters of patients were colored in red and black and the two most distinct clusters of probes were separated into cluster 1 and cluster 2 by k-means clustering. MGIA control was significantly improved (p < 0.003) in the black cluster compared to the red cluster. A Welch Two Sample t-test was performed between groups. Rx, treatment.