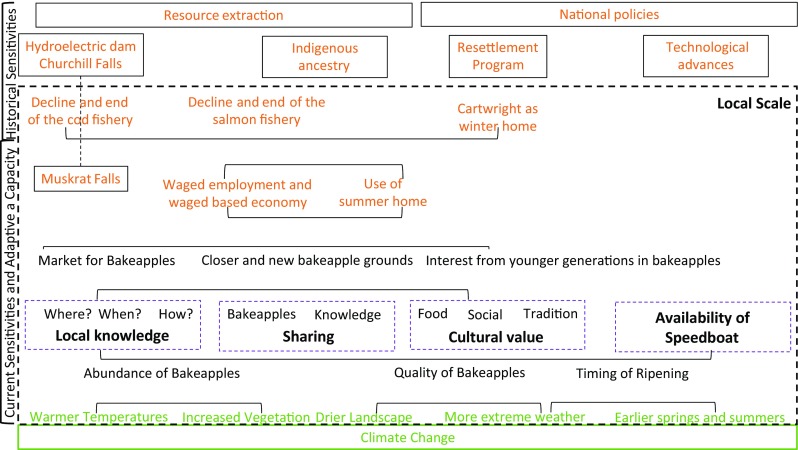
Fig. 3.

A diagram of the vulnerability of bakeapple picking to physical and social changes. The exposures are in green; the adaptive capacities are in purple; the sensitivities are in orange. The local scale is marked with a dotted black square. The current and historical components are indicated on the left of the figure. Arrows show the interactions between different components
