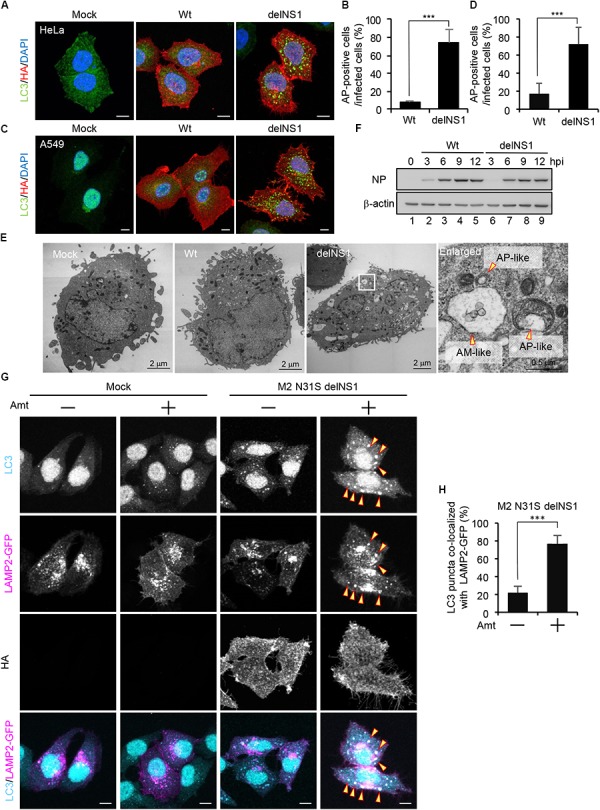
FIGURE 1.

The influenza A virus NS1 protein inhibits the autophagosome formation. (A–D) HeLa cells (A) and A549 cells (C) were infected with influenza A/PR/8/34 virus (Wt) or delNS1 virus at MOI of 3. At 10 h post-infection, cells were subjected to the indirect immunofluorescence assays with mouse anti-HA (red) and rabbit(anti-LC3 antibodies (green). Nuclei were stained with DAPI (blue). Scale bar, 10 μm. The average percentage of cells exhibiting LC3 puncta relative to total infected cells and standard deviations determined from three independent experiments were shown in panel (B) (HeLa cells) and (D) (A549 cells) (AP; Autophagosome, n > 100). The statistical significance was determined by Student’s t-test, ∗∗∗P < 0.001. (E) HeLa cells were infected with delNS1 virus at MOI of 3. At 10 h post-infection, cells were pelleted and subjected to transmission electron microscopy analysis (AP; Autopahgosome, AM; Amphisome). (F) HeLa cells were infected with either Wt (lanes 2–5) or delNS1 (lanes 6–9) virus at MOI of 3. At 3, 6, 9, and 12 h post-infection, the cells were lysed, and the lysates were analyzed by SDS-PAGE followed by western blotting with anti-NP and anti-β-actin antibodies. (G,H) HeLa cells expressing GFP-LAMP2 (shown in magenta) were infected with M2-N31S delNS1 virus at MOI of 3 with or without 50 μM amantadine (Amt). At 10 h post-infection, cells were subjected to the indirect immunofluorescence assays with anti-LC3 (cyan) and anti-HA antibodies. The arrowheads indicate LC3 puncta co-localized with LAMP2-GFP. Scale bar, 10 μm. The average percentage of LC3 puncta co-localized with LAMP2-GFP relative to total LC3 puncta and standard deviations determined from three independent experiments were shown in panel (H) (n > 100). The statistical significance was determined by Student’s t-test, ∗∗∗P < 0.001.)
