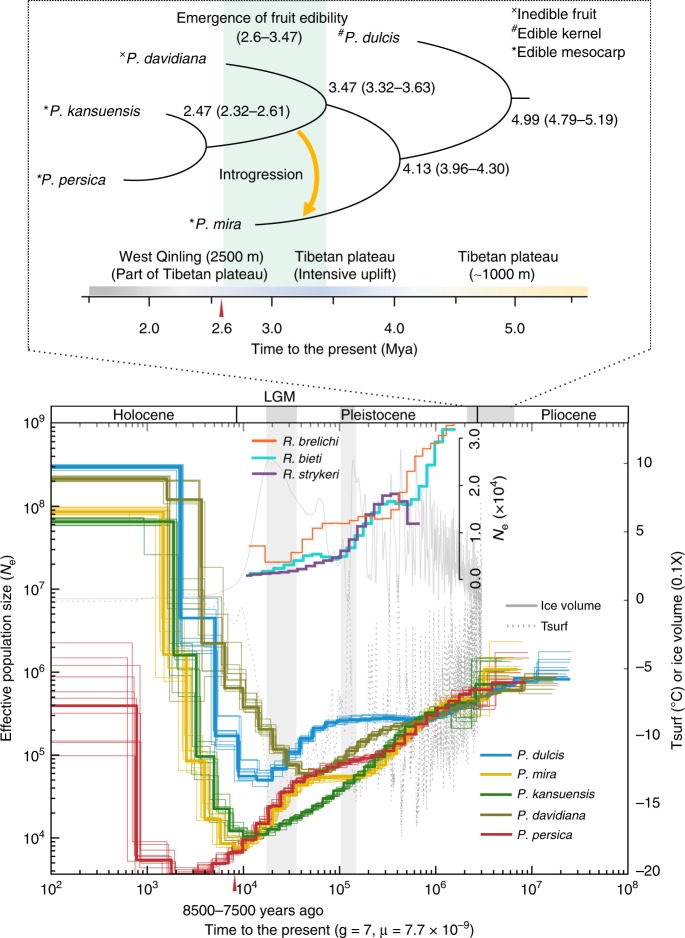
Fig. 3.
Speciation and demographic history of peach species. BEAST analysis was used to estimate divergence times of P. persica, P. kansuensis, P. davidiana, P. mira, and P. dulcis, and an MSMC model was used to infer their effective population (Ne) fluctuations under a mutation rate μ = 7.7 × 10⁻⁹ per site per generation according to Xie et al.17. The divergence time of each species was shown in each branch, the emergence time of edible fruit in peach species (4.13–2.6 Mya) was showed with green shadow, and a single introgression event is indicated with an orange arrow between P. mira and the common ancestor of P. kansuensis and P. persica. Peach speciation likely was influenced by uplifts of the Tibet plateau. In the demographic diagram, the gray solid and dotted lines show, respectively, the ice volume and the global surface air temperature (Tsurf), as reconstructed using benthic oxygen isotope (δO18) stack record data70, and the Ne trajectories of three monkey species (Rhinopithecus. brelichi, R. bieti, and R. strykeri) from Zhou et al.28 are inserted in the diagram. Two red triangles indicate peach endocarp fossil evidence from 2.6 Mya and 8500–7500 years ago, respectively4,5. LGM, Last Glacial Maximum

