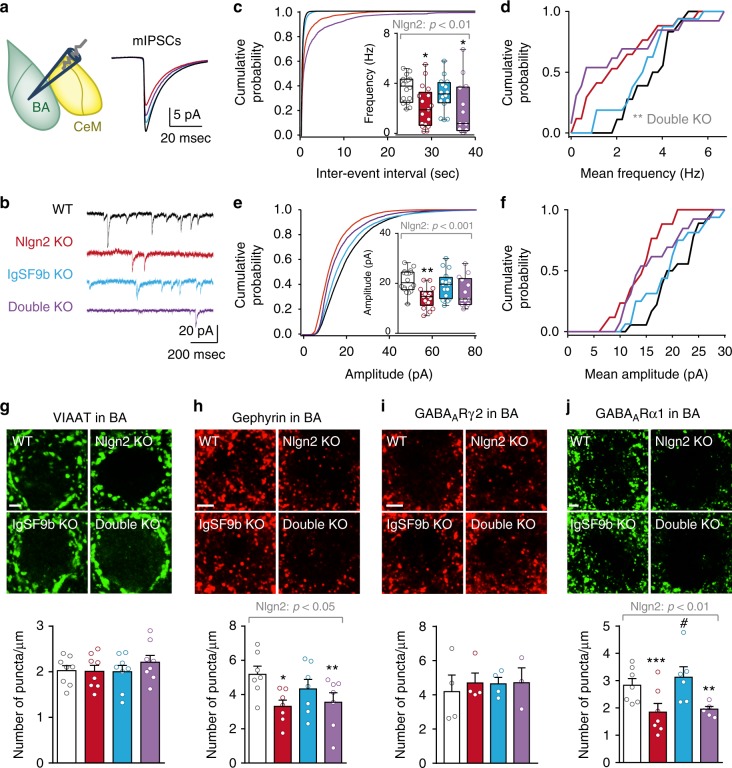
Fig. 7.
IgSF9b deletion does not affect inhibitory synapses in the BA. a, b Schematic diagram illustrating recording sites in the BA, mean mIPSCs and representative mIPSC traces from the BA of WT, Nlgn2 KO, IgSF9b KO, and double KO mice. c Average cumulative distribution of mIPSC inter-event intervals and quantification of mean mIPSC frequency in the BA. d Probability distribution of mean mIPSC frequency of each analyzed cell in the BA. Kolmogorov–Smirnov test: WT vs. Double KO, p < 0.0001. e Average cumulative distribution of mIPSC amplitudes and quantification of mean mIPSC amplitude in the BA. f Probability distribution of mean mIPSC amplitude among all analyzed cells in the BA. n = 13–18 cells/5–6 mice per genotype. g–j Photomicrographs and quantification of the number of perisomatic puncta of g VIAAT, h gephyrin, i GABAARγ2, and j GABAARα1 in all four genotypes. Scale bar, 2 μm. n = 3–8 per genotype. Statistically significant ANOVA comparisons are marked in gray at the top of the panels and are listed in Table 1. For all other ANOVA comparisons F < 1. Post-hoc analysis: *p < 0.05 relative to WT, **p < 0.01 relative to WT, ***p < 0.001 relative to WT, #p < 0.05 relative to double KO. Error bars represent SEM. Box plots represent median and 25th and 75th percentiles and whiskers are drawn from the minimum to the maximum value. WT, white bars; Nlgn2 KO, red bars; IgSF9b KO, blue bars; double KO, purple bars

