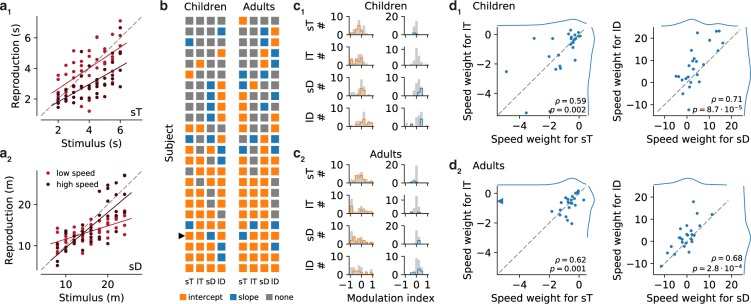
Figure 6.
Dependence of time and distance estimation on movement speed. (a) Examples of speed-modulation in time (a1, short time intervals, sT) and distance estimation (a2, short distances, sD) for one child. Individual reproduced values are given as dots. Trials at low speed are indicated by light red and trials at high speed by dark red. Solid lines of matching color are corresponding linear fits. Gray dashed lines mark the bisecting line. The participant displays a significant shift to smaller reproductions at high speed for sT but a significant increase in the slope of the range of reproductions at high speed for sD. (b) Characteristics of speed dependence across children and adults. Each square marker indicates a significant shift (intercept change, orange), a slope change (blue) or a none significant effect, respectively, in a particular stimulus range (columns). Each row corresponds to one participant. The arrow head marks the participant from (a). (c) Histograms of modulation indices for children (c1) and adults (c2). Left column of panels displays effect sizes for intercept and right panels for slope. Colored outlines indicate participants with significant influence on intercept or slope, respectively. (d) GLM analysis of speed dependence. Comparison of weights for speed in the GLMs for sT and lT (left panels), and for sD and lD (right panels) for children (d1) and adults (d2). Gray dashed lines are bisecting lines. Spearman ρ and p-values are given in each panel. Marginal distributions are given at the right and the top of each plot. The arrow head in the left panel of d2 points to an outlier at (−8.3, −0.5).

