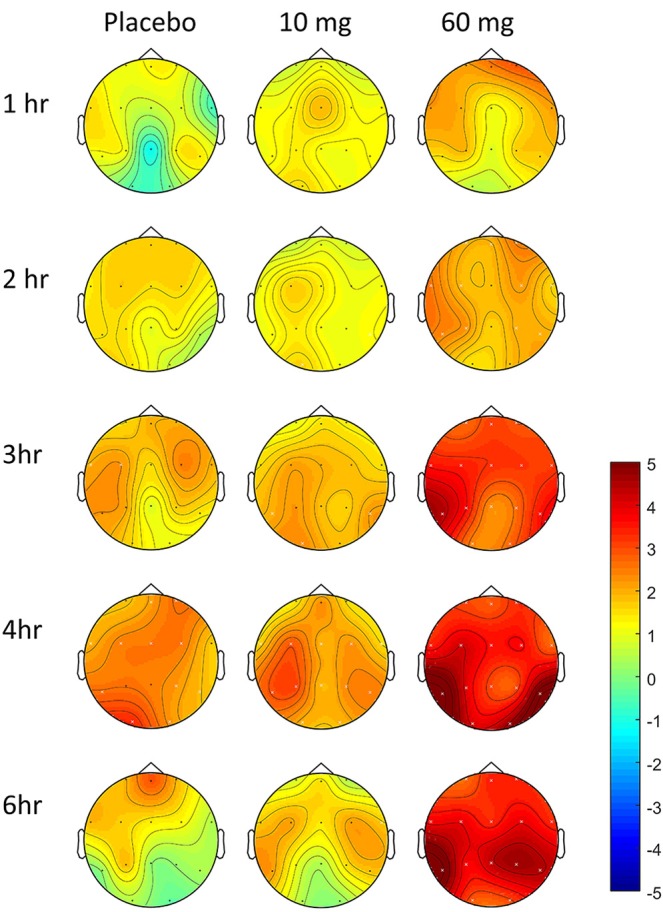
Figure 7.

Effect of baclofen on change in theta power over time in controls, relative to baseline. Data are theta power (4–8 Hz EEG activity), change from baseline comparisons after placebo (n = 7), 10 mg baclofen (n = 5) and 60 mg baclofen (n = 7) at five time points following dosing (eyes shut). Pre-intervention baseline spectra were subtracted from spectra at each post-intervention time-point (1, 2, 3, 4, and 6 h post baclofen) to provide statistical maps (paired t statistics). Red indicates relatively more power following baclofen, and blue indicates relatively less power. Black dots represent location of electrodes. Differences relative to baseline were tested using permutation testing; white crosses represent channels with significant differences relative to baseline (FDR corrected).
