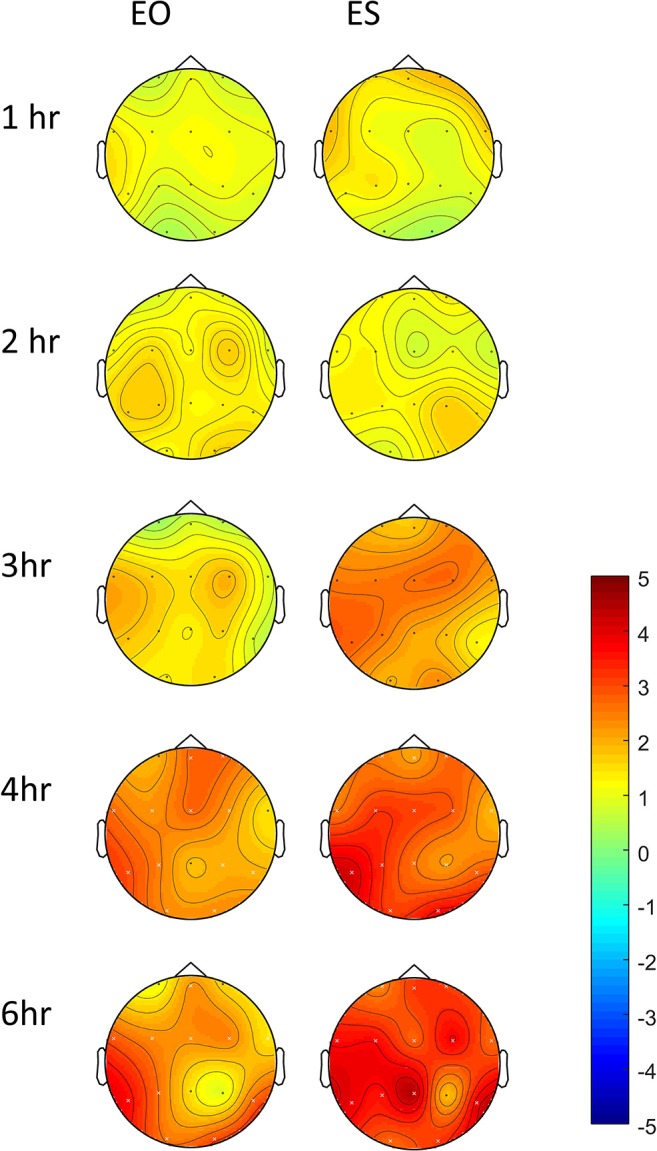
Figure 8.

Differences in change-from-baseline theta power between placebo and 60 mg baclofen, shown with both eyes open (EO) and eyes shut (ES) at 5 time points in controls (n = 7). Contrasts were performed between placebo and baclofen (t statistics of difference between the difference at baseline) to create one image per time point. This represents a subtraction of column 1 (placebo) from column 3 (60 mg baclofen) as depicted in Figure 7. Red indicates relatively more power following baclofen relative to placebo. Electrodes with significant differences between placebo and baclofen are shown with a white cross, corresponding to p < 0.05, FDR corrected.
