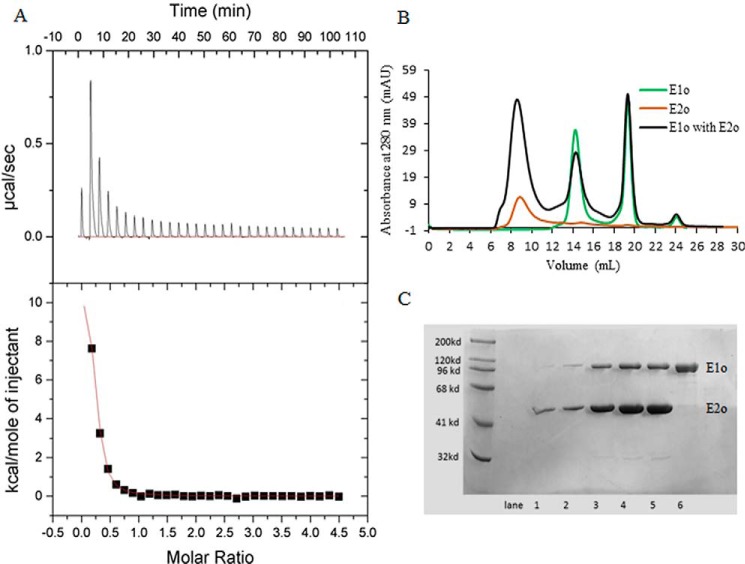
Figure 1.
Isothermal titration calorimetry and size-exclusion chromatography to probe the formation of the binary hE1o–hE2o subcomplex. A, ITC probing of the hE1o–hE2o subcomplex formation. Top panel, raw data obtained from a series of 10-μl injections of hE1o (25 μm subunit concentration) into the cell containing hE2o (450 μm subunit concentration) and plotted as heat change versus time. Bottom panel: plot of the areas under peaks in A against the molar ratio of hE1o injected. The Kd of 0.95 ± 0.10 μm for the hE1o–hE2o subcomplex formation was calculated from the fit of the experimental data to a single site–binding model. B, SEC demonstration of the hE1o–hE2o binary subcomplex formation. The hE1o and hE2o were preincubated at 2:1 molar ratio of subunits in 50 mm KH2PO4 (pH 7.5) containing 0.15 m NaCl, 0.5 mm ThDP, and 1.0 mm MgCl2 for 1 h at room temperature followed by elution on an analytical Superose 6 column with 1 ml/min flow rate (black). In control experiments, the hE1o by itself was eluted with 14.4 ml; the ThDP by itself was eluted with 18–20 ml (both in green); the hE2o by itself was eluted in the void volume (brown). C, SDS-PAGE analysis of the eluted protein peaks (from B). Lanes 1–5 correspond to hE1o–hE2o binary subcomplex, eluted with 6–11 ml. Lane 6 corresponds to hE1o by itself eluted with 14–16 ml.

