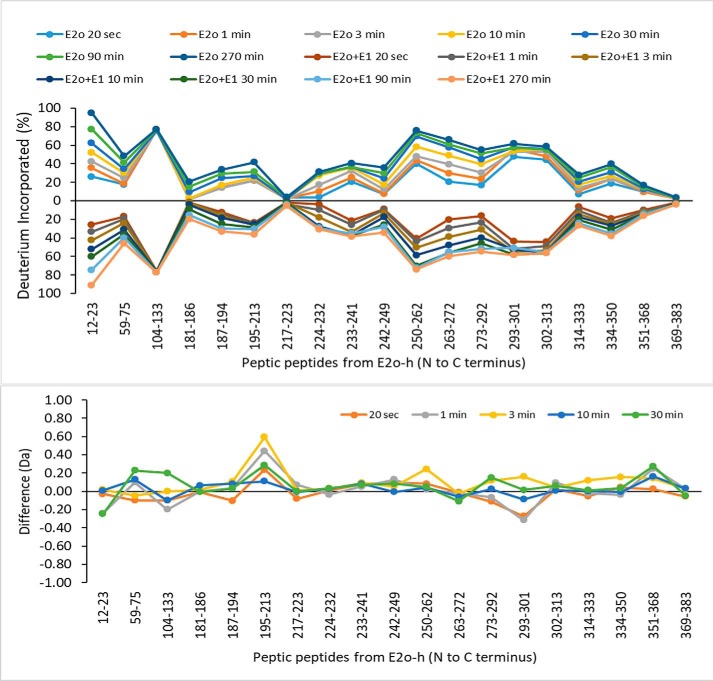
Figure 8.
Comparative HDX-MS analysis of the hE2o by itself and in the presence of hE1o. Top panel, Butterfly plot representing average relative deuterium incorporation percentage (ΔD%, y axis) (deuterons exchanged/maximum exchangeable amides × 100%) of peptic peptides from the hE2o, (x axis, listed peptic peptides from the N to C terminus)) in the absence of hE1o (top part) versus in the presence of hE1o (bottom part). Bottom panel, difference plot showing the change in deuterium incorporation of peptic fragments originated from hE2o in the absence and presence of hE1o (ΔΔD, y axis) (deuterons exchanged in the absence minus deuterons exchanged in the presence of hE1o).

