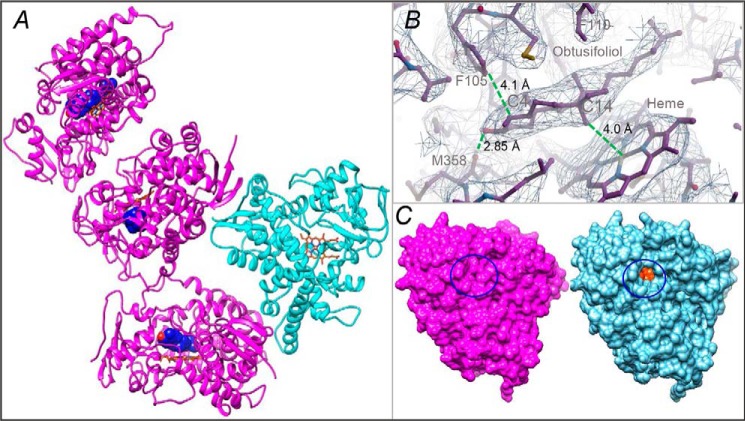
Figure 2.
X-ray structure of CYP51 in the substrate-bound (magenta) and ligand-free (cyan) state. A, the asymmetric unit. The carbon atoms of the substrate (obtusifoliol) molecule are seen as blue spheres, and the C3 OH oxygen is red. The heme is shown as a stick model, and the carbon atoms are orange. B, the 2Fo − Fc electron density map of the obtusifoliol area is shown as a mesh contoured at 1.2 σ, prepared in Coot. The distances between the C14α-methyl group and the heme iron, the C3-OH and the carbonyl oxygen of Met-358, and the C4 atom and Phe-105 are marked with dashed green lines. C, surface representation of the substrate-bound and ligand-free molecules, distal P450 view. The substrate entry area (closed in the substrate-bound and open in the ligand-free structure) is circled. The heme is seen as orange spheres (see also Fig. S2C).

