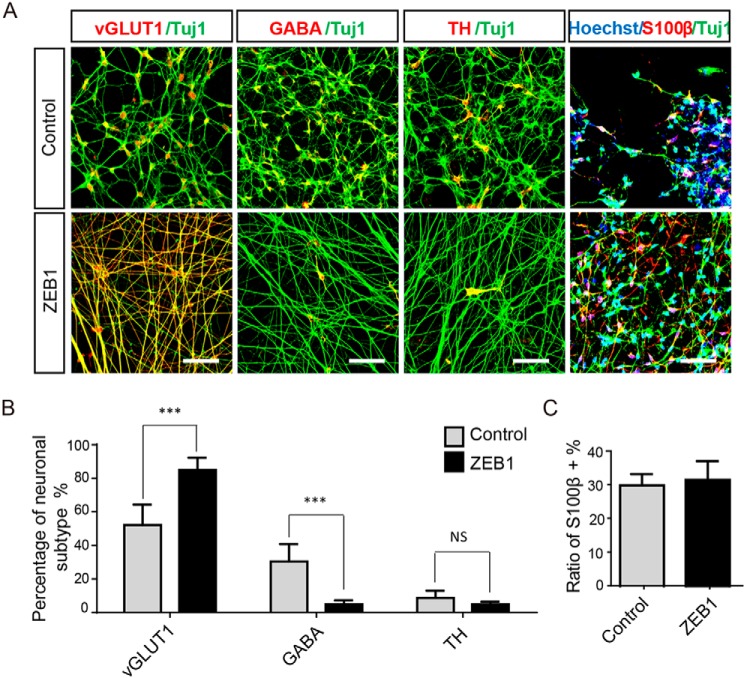
Figure 5.
Forced expression of ZEB1 facilitated differentiation of excitatory neurons. A, representative immunofluorescent images of specific subtypes of neurons in control and the ZEB1-overexpression group at 8 weeks of neural differentiation from hESCs using the indicated antibodies; n = 3. Scale bar: 50 μm. B, quantification and statistical analysis of different types of neurons as indicated in A respect to the number of TUJ1+ cells; n = 3. Scale bar: 50 μm. C, statistical analysis of the S100β-positive cells respected to total cells. For statistical analysis, cells were counted under ×20 objective by selecting 10 fields randomly for each group from each experiment. Bars represent mean ± S.D. of three experimental replicates. ***, p < 0.001; **, p < 0.01. NS, not significant.

