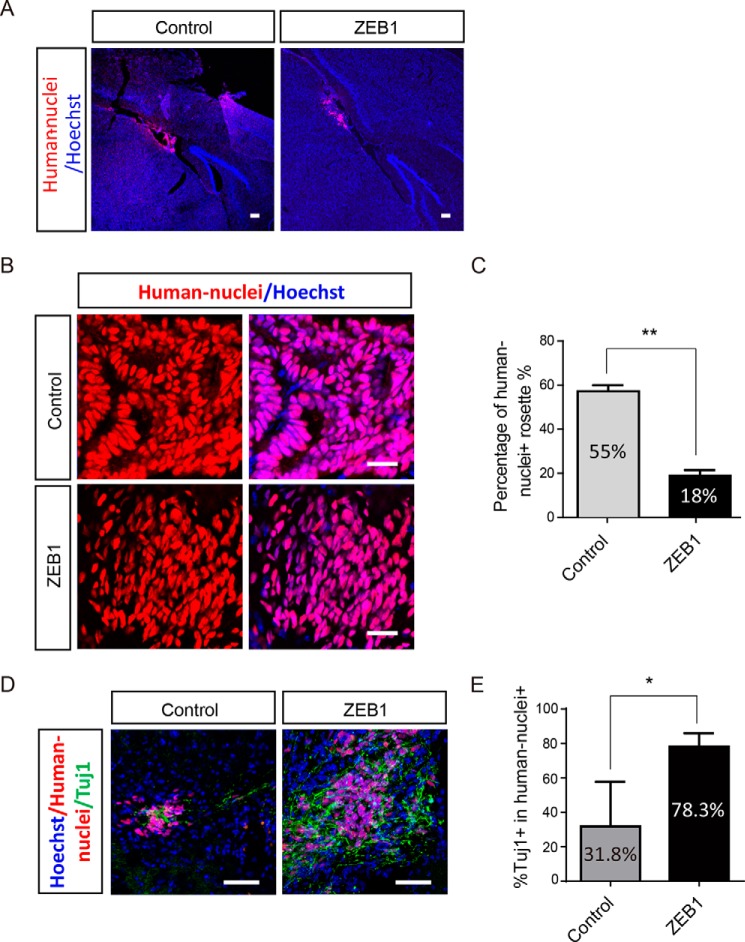
Figure 6.
Overexpression of ZEB1 decreased the risks of tumor formation of transplanted cells derived from hESCs. A, representative images showing the distribution of transplanted cells in vivo based on a human nuclei antibody immunostaining along with Hoechst staining (nuclei) 10 weeks after transplantation of hESCs-derived cells. Scale bar: 2 mm (left panel), 50 μm (middle and right panels). Arrows indicate the region of graft cells distribution with human nuclei staining. B, immunostaining images showing the difference of grafted cells from control and ZEB1-overexpressed groups in vivo. Scale bar: 50 μm. C, statistical analysis of the percentage of human nuclei-positive rosettes-like structure in the control and ZEB1 overexpression groups as shown in B. D, representative images of grafted cells (human nuclei-positive) expressing the neuronal marker βШ-tubulin (TUJ1) after transplantation. Arrows indicate the typical co-labeled neurons; n = 3. Scale bar: 50 μm. E, statistical analysis for the percentage of brain slices with TUJ1+ cells in the two groups as representatively shown in D. For the statistical analysis, 100–200 brain slices from 9 mice were analyzed, and the brain slices without human cells were discarded directly. **, p < 0.01; *, p < 0.05. Bars represent mean ± S.D. of three experimental replicates.

