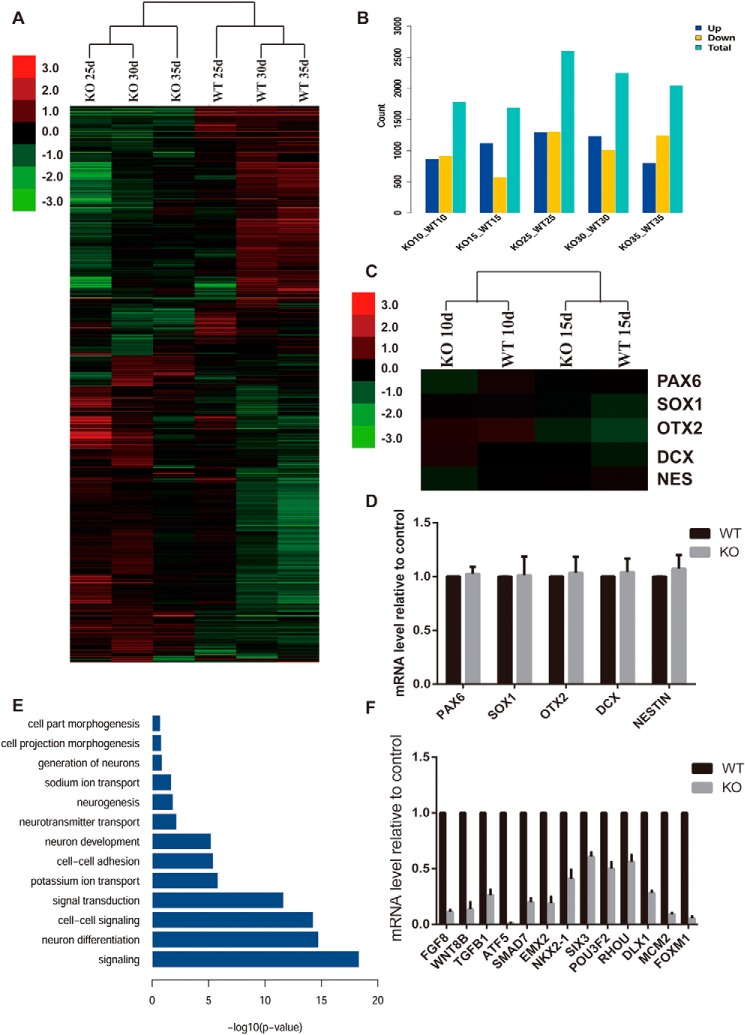
Figure 7.
Whole genome RNA sequence analysis of gene expression profiles. A, hierarchical clustering analysis of the whole genome profiles during the differentiation. RNA were harvested at the indicated time points. B, histogram showing the DEGs between WT and ZEB1 KO cell lines at the indicated time points. C, hierarchical clustering analysis of specific neuronal related genes at early stage between the 2 cell lines. D, quantitative real-time PCR analysis confirm the genes expression referred in C. E, GO analysis of the significantly differentially expressed genes at 25 days of the differentiation. F, quantitative real-time PCR analysis confirm the genes expression picked from DEGs related to neuronal development.

