Figure 1.
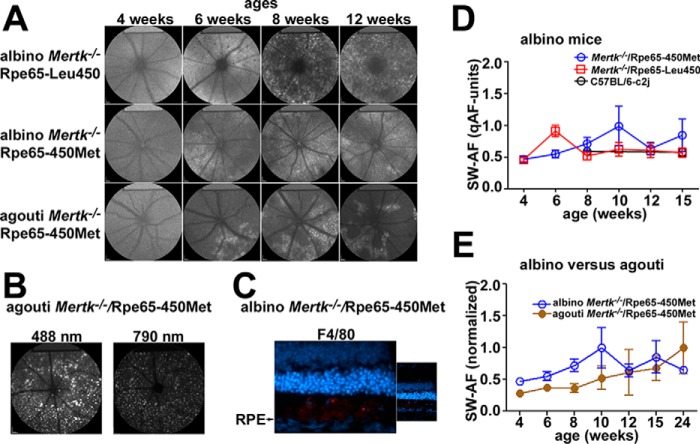
Fundus AF (488 and 787 nm) in Mertk−/− and WT mice varying in the Rpe65-L450M variant and in melanin content (albino and agouti). A, SW-AF fundus images (488-nm excitation) acquired from Mertk−/− mice at the ages indicated. Autofluorescent puncta are more visible in the agouti mice due to ocular pigmentation. B, SW-AF (488 nm) and NIR-AF (790 nm) images (age 24 weeks). Autofluorescent spots in SW-AF are also detectable in NIR-AF images. C, cryostat section stained with antibody to F4/80, a label specific for macrophages (albino Mertk−/−/Rpe65-Leu450, age 6 weeks). The micrograph captured 0.5–1 mm from the optic nerve head. D and E, qAF (488-nm excitation). For quantitation, mean GLs were determined in eight circularly arranged segments located 8.25–19.25° from the disc center and were standardized to GL values determined for the internal fluorescent reference (rectangular area at top of image) to calculate qAF. In E, qAF of albino and agouti mice were normalized to a maximum value of 1. Values are mean ± S.D. (error bars). In some cases, error bars do not extend further than the height of the symbol.

