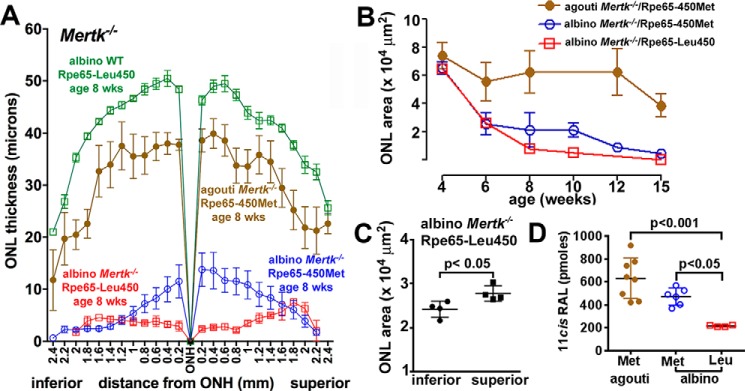
Figure 5.
Photoreceptor cell viability measured as ONL thickness. Mertk−/− mice varying with respect to coat color (agouti, albino) and Rpe65-L450M variant. A, ONL thicknesses plotted as a function of distance from ONH in inferior and superior retina. Values are mean ± S.E. (error bars), 6–10 eyes. B, progression of photoreceptor cell degeneration plotted as decreasing ONL area with age (weeks). C, albino Mertk−/−/Rpe65-Leu450 (age 6 weeks). ONL area was calculated from thicknesses measured 2 mm superior and inferior to the ONH. D, measurement of 11-cis-retinal in Mertk−/− mice. Error bars (B–D), S.D.

