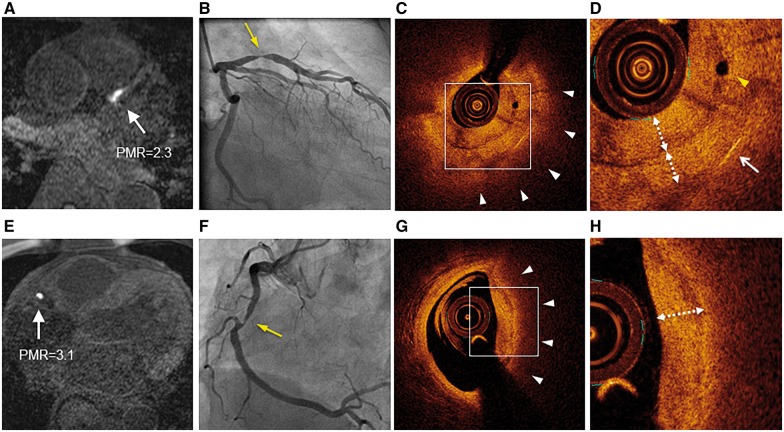
Figure 2.
Representative HIP lesions on T1-weighted imaging and optical coherence tomography. Non-contrast T1-weighted imaging (T1WI) demonstrated HIPs (white arrows) in the proximal left anterior descending artery (A) and in the middle of the right coronary artery (E). These lesions had PMR of 2.3 and 3.1, respectively. Coronary artery angiography revealed significant coronary stenosis in lesions corresponding to HIPs (B and F) (yellow arrows). Optical coherence tomography (OCT) showed a layered signal pattern underlying a signal-poor region with diffuse borders (white arrowheads) in the areas corresponding to each HIP (C and G). The white dotted line with double arrows indicates the layered pattern of OCT signals in high-power images (D and H). The yellow arrowhead indicates a microchannel (D). The white arrow indicates a cholesterol crystal (D). HIPs, high-intensity plaques; PMR, plaque-to-myocardium signal intensity ratio.

