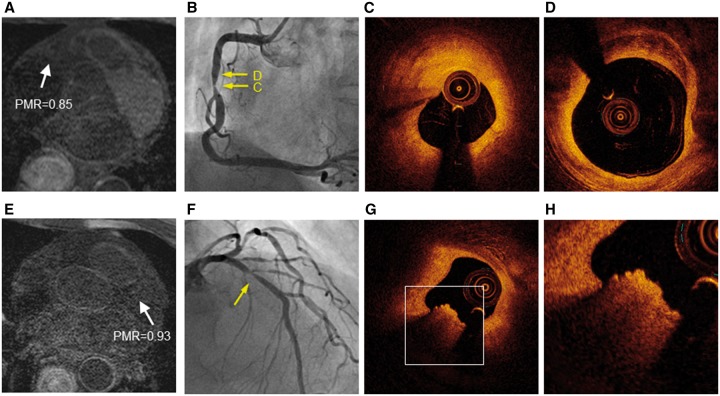
Figure 3.
Representative non-HIP lesions on T1-weighted imaging with corresponding optical coherence tomography. Representative non-HIPs (white arrows) in the middle of the right coronary artery (PMR, 0.85) (A) and proximal left anterior descending artery (PMR, 0.93) (E). Coronary artery angiography revealed significant coronary stenosis (B and F) (yellow arrows). Optical coherence tomography showed that the target lesion was predominately comprised of fibrous plaque without attenuation (C and D). A typical red thrombus was observed in a non-HIP area (G). A higher power image of the white square in (G) is shown in (H). HIPs, high-intensity plaques; PMR, plaque-to-myocardium signal intensity ratio.

