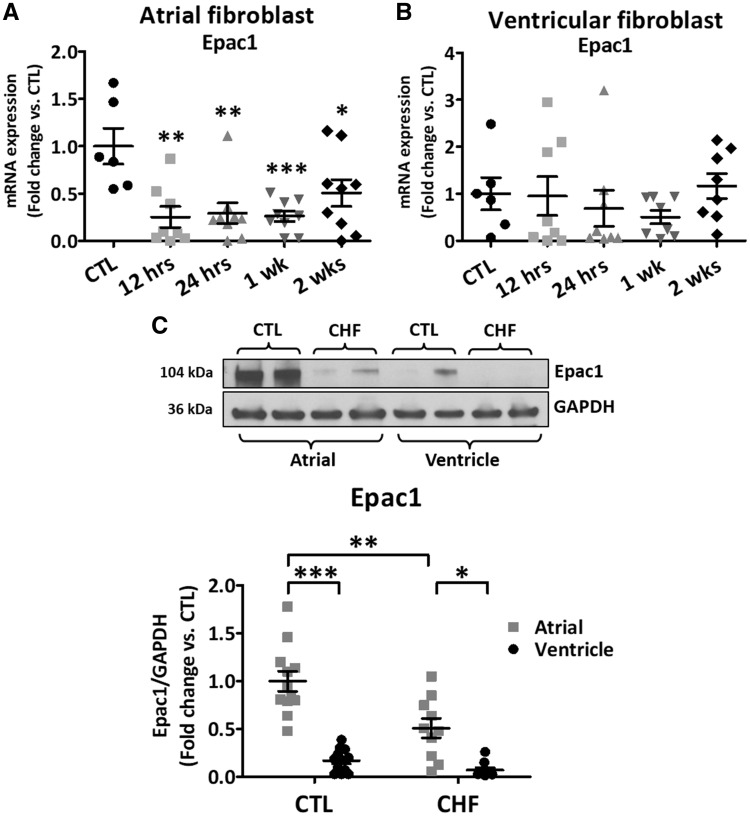
Figure 1.
Epac1 expression during VTP time course. (A, B) Epac1 mRNA expression in isolated atrial and ventricular canine fibroblasts (FBs), respectively, during VTP [*P < 0.05, **P < 0.01, ***P < 0.001 vs. control (CTL), one-way ANOVA followed by Dunnett’s multiple comparison test]. (C) Freshly isolated left-atrial and ventricular fibroblasts were obtained from CTL and 2-week VTP (CHF) dogs. Top Immunoblots for Epac1 protein-expression. Bottom Epac1 protein-expression relative to GAPDH (*P < 0.01, **P < 0.001, ***P < 0.0001, two-way ANOVA followed by the Tukey’s test). Each dot represents an individual animal.

