Figure 2.
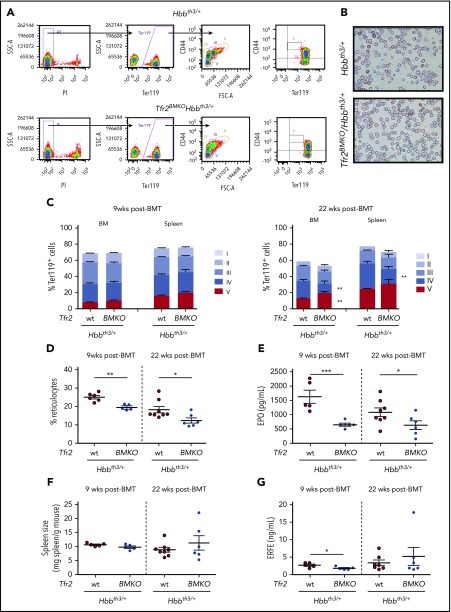
Analysis of erythropoiesis and serum EPO and ERFE levels of Tfr2BMKO/Hbbth3/+mice. Mice were analyzed 9 and 22 weeks after transplantation with thalassemic (Tfr2wt/Hbbth3/+) or Tfr2−/−/Hbbth3/+ (Tfr2BMKO/Hbbth3/+) BM. Mice were fed a standard diet. In the figure are graphed: (A) representative gating strategy for analysis of Ter119 subpopulations in Hbbth3/+ and Tfr2BMKO/Hbbth3/+ mice. Viable cells (impermeable to propidium iodide [PI]) from BM were analyzed for Ter119/CD44 expression. Ter119 were gated and further analyzed with respect to forward scatter (FSC) and CD44 surface expression for subpopulation composition (gated clusters: proerythroblasts [I], basophilic erythroblasts [II], polychromatic erythroblasts [III], orthochromatic erythroblasts and immature reticulocytes [IV], and mature red cells [V]); (B) blood smears stained with May-Grunwald-Giemsa showing the morphology of RBCs of representative Hbbth3/+ and Tfr2BMKO/Hbbth3/+ mice (original magnification ×40); (C) percentage of Ter119+ cells on alive cells and subpopulation composition (gated cluster I-V) based on Ter119/CD44 expression and FSC (reflecting cell size) both in the BM and in the spleen; (D) percentage of reticulocytes in peripheral blood; (E) serum EPO levels; (F) spleen weight normalized to body weight and (G) serum ERFE levels. Bars indicate SE. Asterisks refer to statistically significant differences between age-matched Hbbth3/+ and Tfr2BMKO/Hbbth3/+ mice: *P < .05; **P < .01; ***P < .005. FSC-A, forward scatter area; SSC-A, side scatter area.

