Figure 5.

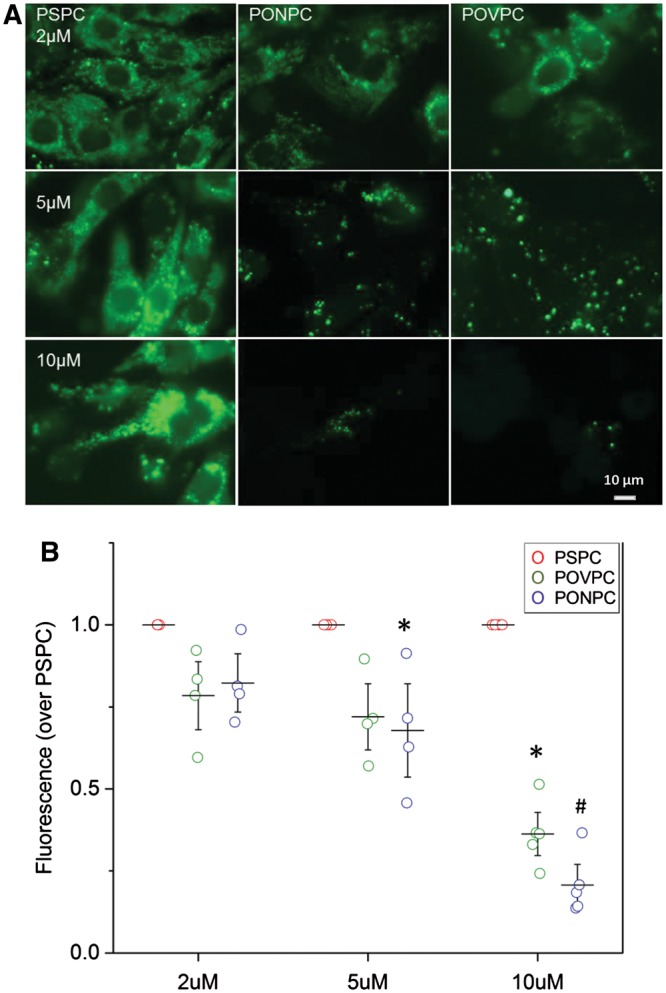
Mitochondrial permeability of NNMC in presence of OxPL. (A) Representative images of NNCM stained with calcein-AM and CoCl2 with exposure to increasing concentrations of POVPC and PONPC to determine mitochondrial permeability as compared to non-oxidized control PSPC. (B) Mitochondrial permeability of NNCM to increasing concentrations of PONPC and POVPC is depicted as the fold change over the fluorescence of non-oxidized control PSPC treated cardiomyocytes stained with calcein-AM and CoCl2 at equal concentrations OxPL’s significantly decreased fluorescence compared to PSPC if *P < 0.05, #P < 0.01, (n = 4) ANOVA.
