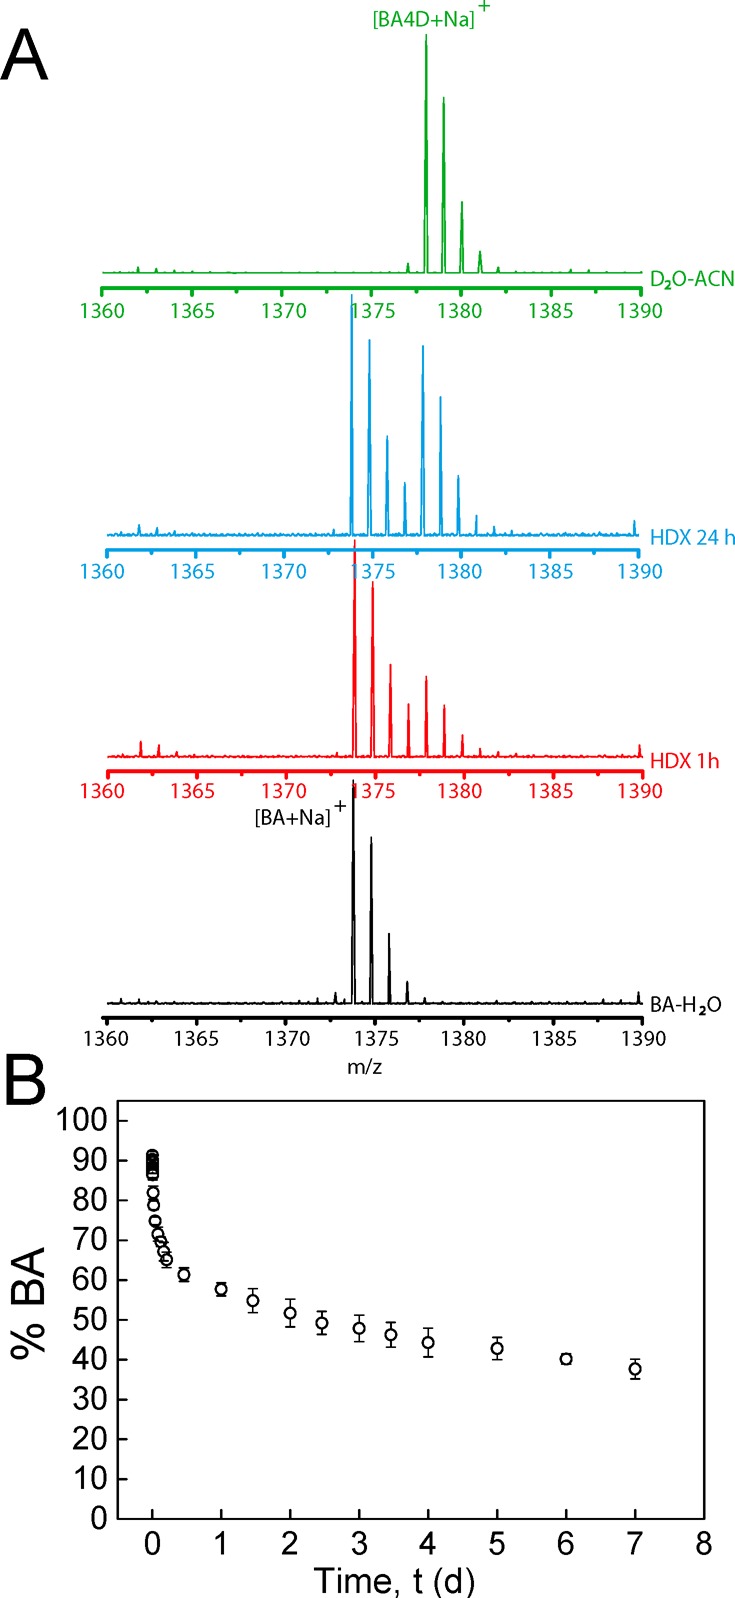
Figure 5.

Time-dependent exchange experiments. (A) Mass spectra during the exchange reaction after 100-fold dilution of a 500 μM BA–H2O solution in D2O or H2O. The spectra at four different stages are presented in different colors: the black spectrum is a reference spectrum of BA diluted in H2O; the red spectrum and the blue spectrum are recorded after HDX for 1 and 24 h, respectively; the green spectrum is the spectrum of a control measurement where the polymers were diluted 100 times in a solvent mixture containing acetonitrile (ACN–D2O, 1:1 (v/v)) to break down the supramolecular assemblies. (B) Percentage of nondeuterated BA as a function of equilibration time. Error bars represent standard deviation of three separate experiments.
