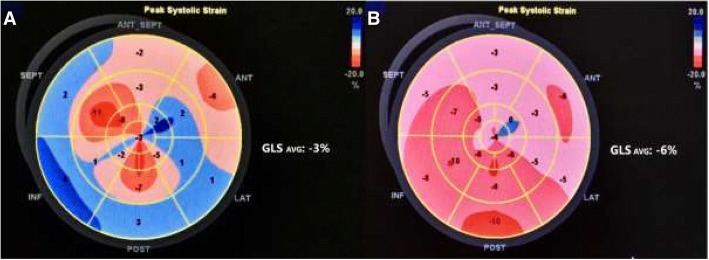
Fig. 1.
Global and segmental longitudinal strain before (a) and after (b) kidney transplantation. The bull’s eye plot displays the regional value of peak systolic strain in all 17 left ventricle segments. Their average value is defined as a global longitudinal strain (GLS). Red colours indicate shortening strains and blue indicates lengthening strains

