Figure 1.
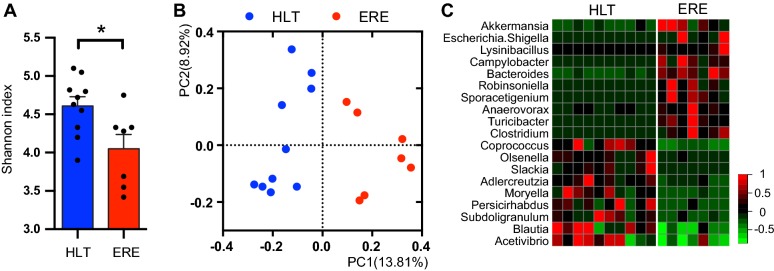
ERE is characterized by dysbiosis of the intestinal microbiota after disease onset. Microbiota composition was analyzed in caecotrophs samples collected from rabbits with ERE (1–3 days after ERE initiation) and compared with those collected from healthy (HLT) age-matched littermate controls. A The Shannon index of the identified OTUs for each sample and mean ± SEM for each group was calculated and plotted (*p < 0.05, Wilcoxon two-sided test). B PCoA from the unweighted UniFrac values calculated between all the samples. The microbiota of samples collected after ERE onset was significantly different from samples of healthy controls (AMOVA, p < 0.001). C Heatmap representing the standard deviation from the mean of the relative abundance of statistically significantly different genera between rabbits with ERE and HLT littermate controls (Wilcoxon two-sided test, p < 0.05, FDR < 0.1). Red colors represent values above the mean and green colors represent values below the mean. N = 10 for the HLT group and 7 for the ERE group (caecotrophs samples could not be collected from 4 ERE rabbits due to the symptomatology or rabbit death).

