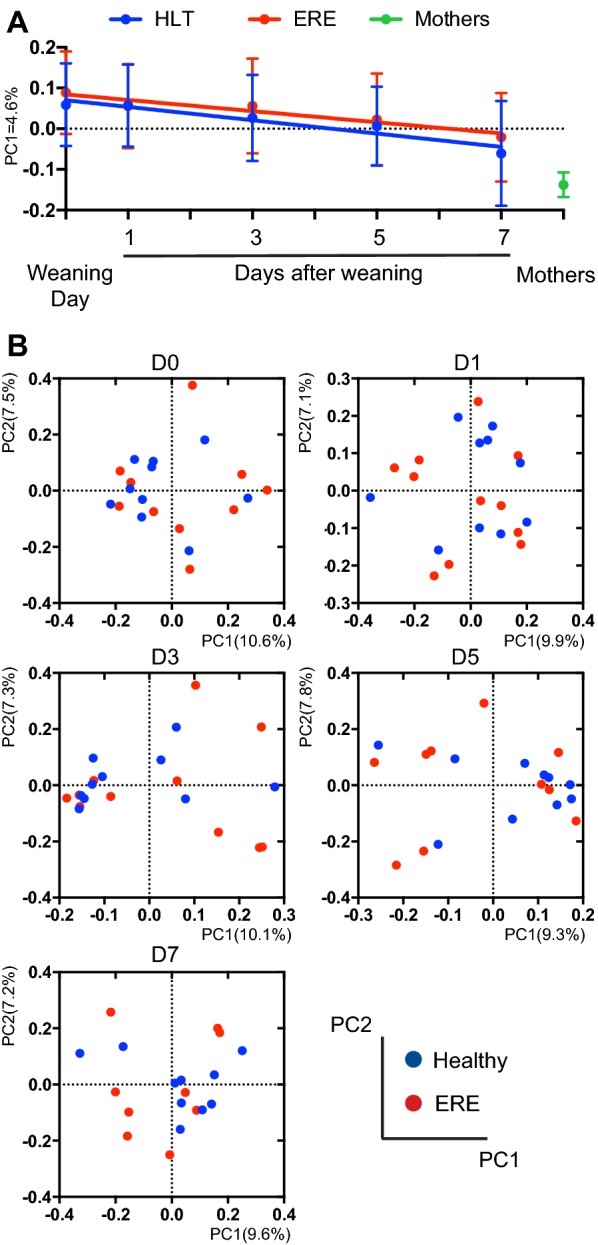
Figure 2.

Evolution of the microbiota after weaning and before ERE onset. Microbiota composition before ERE onset was analyzed in caecotrophs samples collected from rabbits weaned at 30 days of age. Samples from rabbits with ERE, collected the day of the disease onset or after disease initiation, are not included in the analysis. Since most rabbits initiated ERE on day 9 or after, only the day of weaning (day 0) and days 1, 3, 5 and 7 after weaning are shown. A First principal coordinate of analysis of the PCoA from the unweighted UniFrac values obtained between all samples, plotted over time. Mean ± SD is shown for each time point. Samples from healthy (HLT) and ERE rabbits moved from the positive values of the axis defined by PC1 towards the negative values of the axis where the samples from the mothers are located (F test, p < 0.05). No significant difference between both groups in the slope of the regression line was detected (ANCOVA, p > 0.05). B PCoA at different days after weaning obtained from the unweighted UniFrac distance matrix generated between samples from a specific day. No differences were detected using the unweighted UniFrac distance at any analyzed time point (AMOVA, p > 0.05). N = 8–11 per group and time point. Two samples from four mothers, collected the day of weaning and 7 days afterwards were also included in the analysis and are shown in A.
