Figure 3.
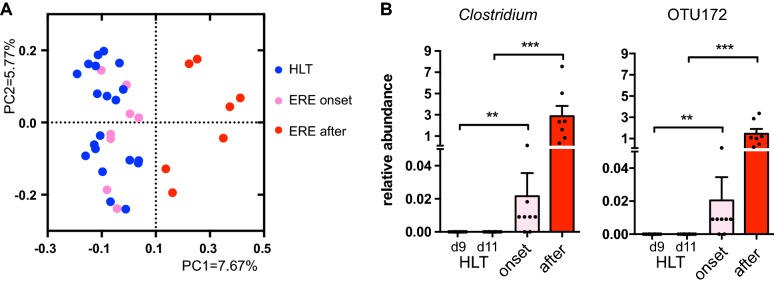
Expansion of a single Clostridium OTU characterizes the microbiota of the ERE onset. Microbiota composition was analyzed in caecotrophs samples collected from rabbits that developed ERE (the day of ERE onset and after onset) and compared with healthy littermate controls (HLT). A PCoA obtained from the unweighted UniFrac values calculated between samples from rabbits with ERE collected the day of onset or after onset and samples from healthy rabbits at similar time points (days 9 and 11 after weaning). The microbiota of samples collected after ERE onset was significantly different from samples of healthy controls and from samples collected the day of ERE onset (AMOVA, p < 0.001). However, the overall microbiota composition the day of ERE onset did not differ from that one of healthy controls (AMOVA, p > 0.05). B Relative abundance of the genus Clostridium, the only change detected in ERE rabbits on the day of onset compared to healthy littermates (Wilcoxon two-sided test, p < 0.05, FDR < 0.1). The altered abundance of this genus in ERE rabbits was due to a single OTU (OTU172). **p < 0.01,***p < 0.001. The mean ± SEM for each group is shown. N = 7–10 per group and time point.

