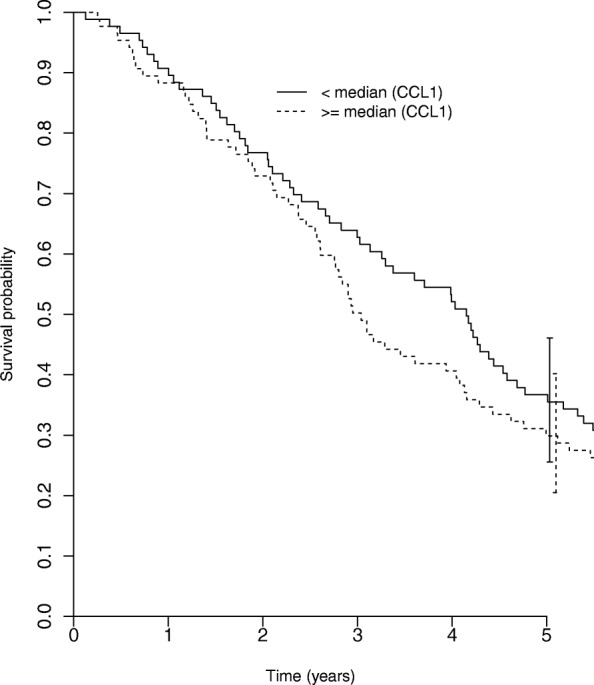
Fig. 2.

Effect of intratumoral CCL1 on patient survival. Tumor samples have been divided into CCL1 high-expressing (n = 88) and CCL1 low-expressing tumors (n = 87) based on the median CCL1-positive cell number/mm2 (median = 10.14 cells/mm2). Survival in both groups was then compared with a log-rank test (p = 0.149)
