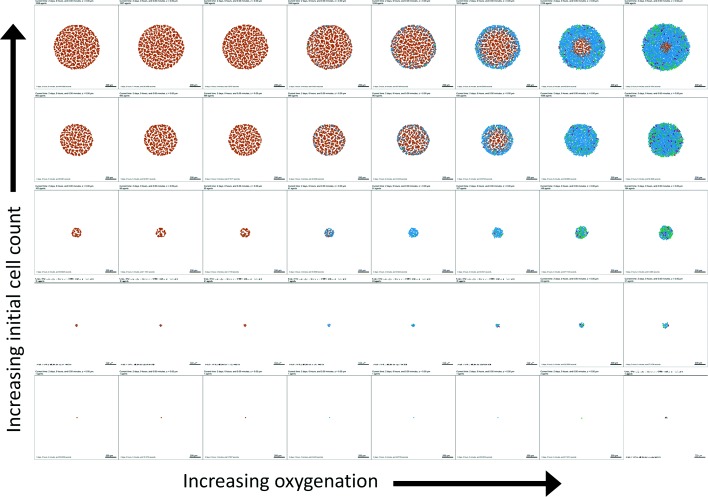
Fig. 3.
First PhysiCell-EMEWS test on cancer hypoxia: tumor plots. Here necrotic cells (dead by oxygen starvation) are brown, non-cycling cells are blue, and cycling cells are green and magenta. Increasing the initial cell count increases the final cell count, but also increases the final dead cell fraction (seen as the increasing prevalence of brown)

