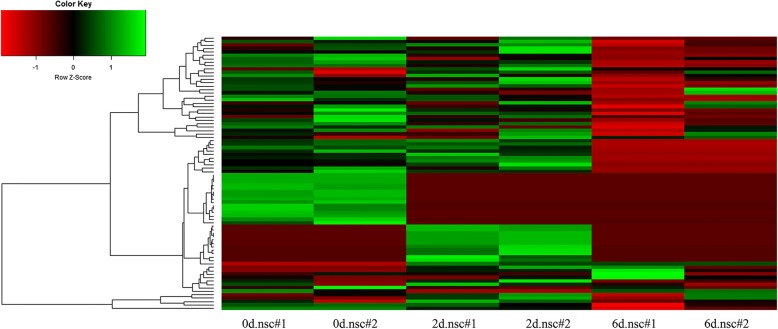
Fig. 3.
Expression profiling of circRNAs detected during NSC differentiation. Heatmap of expression profiles for circRNAs that were detected during the differentiation (68 circRNAs in 0d.nsc, 64 circRNAs in 2d.nsc and 43 circRNAs in 6d.nsc), red to green color bar indicates the expression level from low to high

