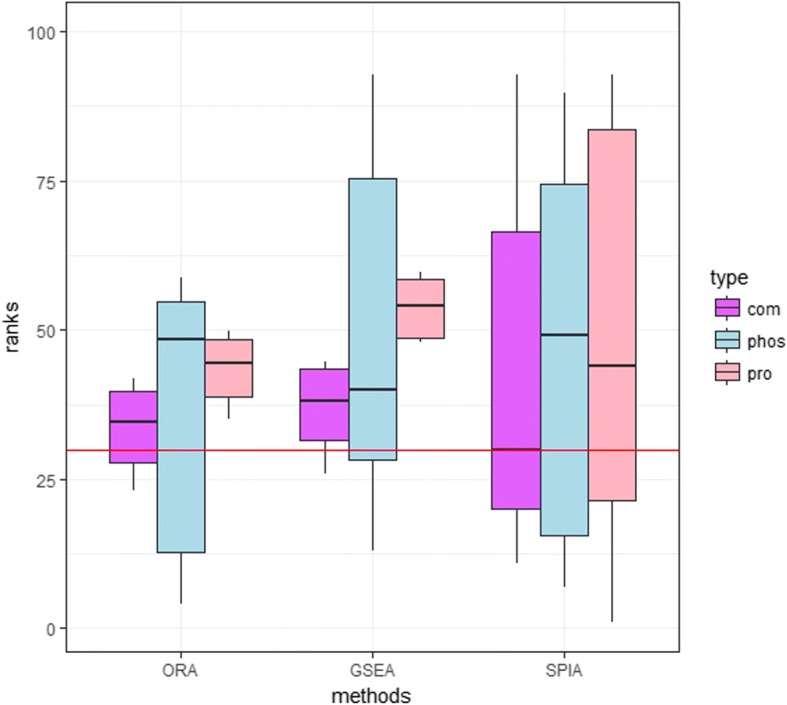
Fig. 2.

Box plot of the ranks for the target pathways in breast cancer. The ranks were normalized in the range of 1 to 100. Lower rank is, better performance of the method is. The orchid, blue and pink represent the method based on the integrated information, information from proteomic and phosphoproteomic data
