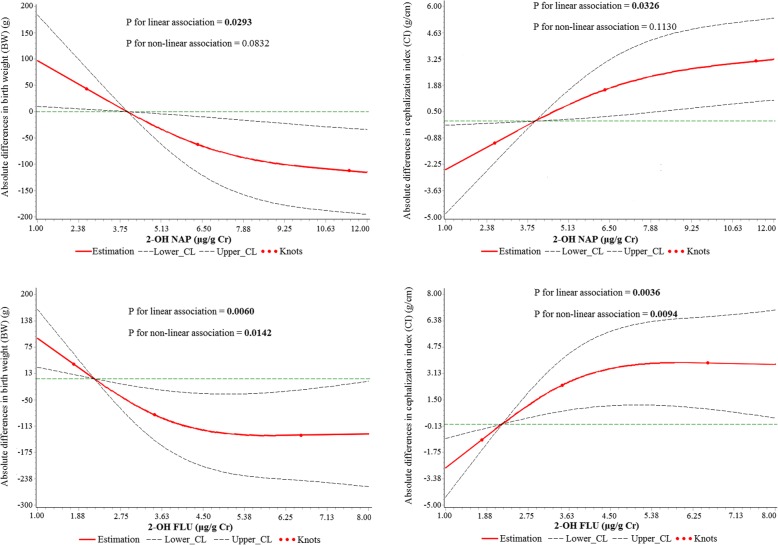
Fig. 2.
Restricted cubic spline models representing the associations of maternal urinary 2-OH NAP, and 2-OH FLU with birth outcomes (BW and CI) after adjustments for parity, maternal BMI, maternal age, gender of newborn, gestational age, eating grilled meat, passive smoking, and levels of three other PAH metabolites, urinary phenol, and cord blood lead. Dashed lines represent 95% CIs; the red knots represent urinary PAH metabolite concentrations at the 15th, 50th, and 85th percentiles

