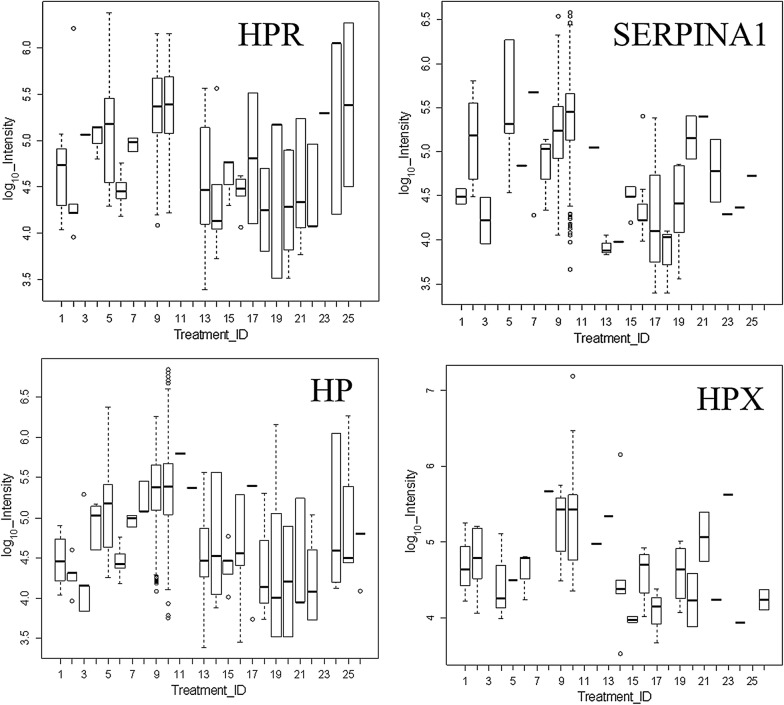
Fig. 5.
The variation in known plasma proteins across the clinical treatments. Treatment ID numbers: 1, Alzheimer normal; 2, Alzheimer normal control STYP; 3, AlzHeimer’s dementia; 4, Alzheimer’s dementia STYP; 5, Cancer breast; 6, Cancer breast_STYP; 7, Cancer_control; 8, Cancer control STYP; 9, Cancer ovarian; 10, Cancer ovarian_STYP; 11, Ice Cold; 12, Ice Cold STYP; 13, Heart attack Arterial; 14 Heart attack Arterial STYP; 15, Heart attack normal control, 16, Heart attack normal Control STYP; 17, Heart attack; 18, Heart attack STYP; 19, Multiple Sclerosis normal control; 20, Multiple Sclerosis normal control STYP; Multiple Sclerosis; 22, Multiple Sclerosis STYP, 23 Sepsis; 24, Sepsis STYP; 25, Sepsis normal control; 26, Sepsis normal control STYP. The ANOVA analysis of the proteins shown across treatments produced a significant F Statistic for means comparisons by Tukey–Kramer HSD test that showed significant differences between ovarian cancer or ovarian cancer STYP, versus the normal female control and/or breast cancer (see Additional file 1: Table S1, Additional file 2: Table S2 for Tukey–Kramer results for each protein shown). STYP: serine, threonine, tyrosine phosphorylation. Note that many proteins were not detected in the ice cold plasma

