Fig. 2.

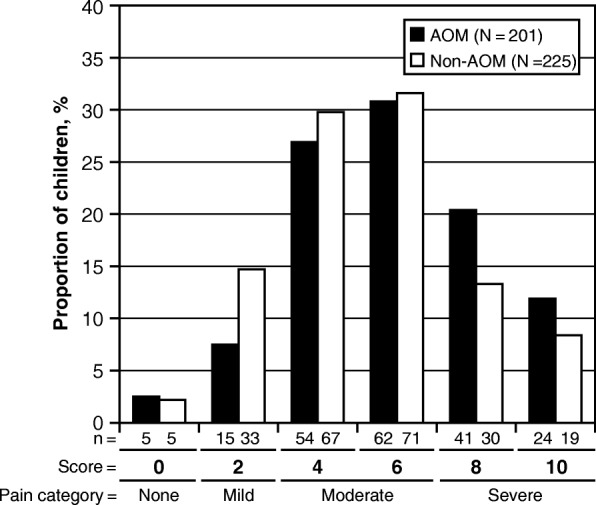
Distribution of the Faces Pain Scale-Revised (FPS-R) scores in children in the AOM group and in children in the non-AOM group. The numbers below the bars show the number of children with the score, indicating the numerator (n)

Distribution of the Faces Pain Scale-Revised (FPS-R) scores in children in the AOM group and in children in the non-AOM group. The numbers below the bars show the number of children with the score, indicating the numerator (n)