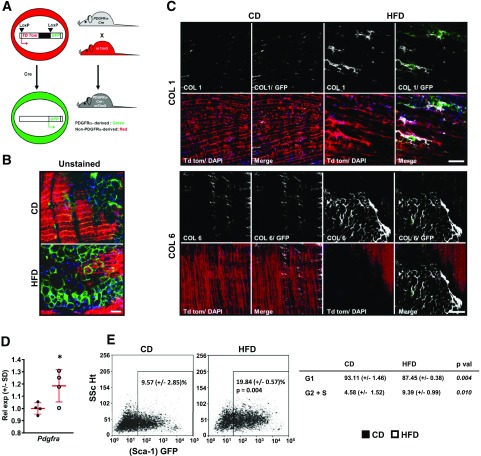
Figure 4.
Diaphragm FAPs give rise to adipocytes and collagen-producing cells in DIO mice. A: PDGFRα Cre-mT/mG mouse model used for lineage tracing of cells derived from PDGFRα+ precursors as GFP+ cells and others as Td tomato (Td tom)+ cells. B: Confocal whole-mount images of unstained diaphragms from 6-month CD and HFD PDGFRα Cre-mT/mG mice. Representative images from four animals per group. Scale bar = 50 μm. C: Immunostaining for COL1 and COL6, respectively, in whole-mount costal diaphragm samples from the same animals. Note deposition of COL1 near GFP+ cells and distribution of COL6 surrounding clusters of adipocytes. Scale bar = 100 μm. D: Pdgfra mRNA levels in whole costal diaphragms of WT C57Bl/6 mice fed CD or HFD for 6 months. n = 4 CD-fed and 5 HFD-fed animals. E: Flow cytometry plots showing percent GFP+/CD31−/CD45−/integrin α7− nucleated cells (FAPs) among total nucleated cells isolated from costal diaphragms of 6-month CD and HFD Sca-1 GFP mice. Representative plots (each showing cells from the costal diaphragm of a single animal) from four unique experiments. Table shows percentage of FAPs in G1 and G2 + S phase (analyzed using DAPI signals). Data analysis employed Student t test. p val, P value. Rel exp, relative expression between groups; SSc Ht, side scatter height. *P < 0.05.

