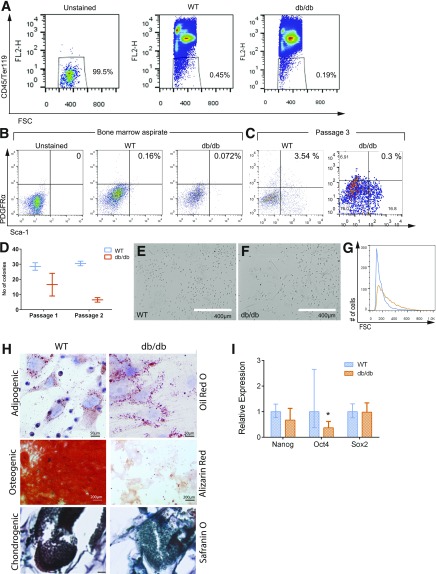
Figure 1.
dBMSCs demonstrate reduced multipotent cell characteristics. A: Nonhematopoietic fractions of BM aspirates between WT and db/db mice. B: Phenotypic comparison of CD45–/Ter119–/PDGFRα+/Sca-1+ BMSCs in WT and db/db BM aspirates using cell surface markers. C: CD45–/Ter119–/PDGFRα+/Sca-1+ BMSCs in P3 cell culture. D: Single cell–based colony-forming assay. E and F: Morphology of WT and dBMSCs in culture. G: Comparison of nuclei size between WT and dBMSCs. H: Stained WT and dBMSCs after 14 days in differentiation media as indicated. Bottom panel scale bar = 100 μm. I: Gene expression of pluripotency genes. Data represented as mean ± SD; n ≥ 3. *P < 0.05. See also Supplementary Fig. 1. FSC, forward scatter.

