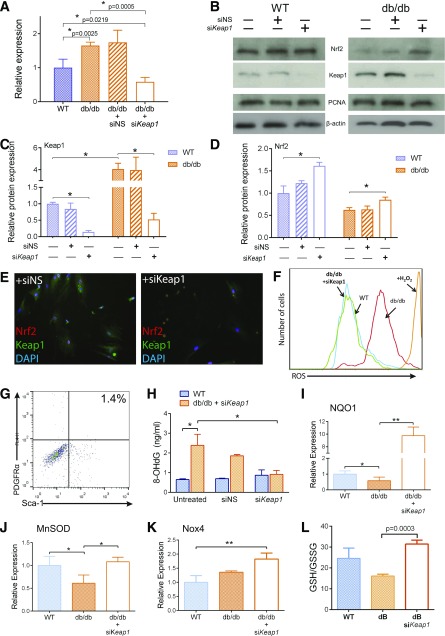
Figure 3.
Knockdown of Keap1 restores Nrf2-mediated antioxidant and metabolic mechanisms in dBMSCs. A: Relative expression of Keap1 after silencing, 24 h posttransfection. NS served as a negative control for transfection. B: Immunoblot of nuclear and cytoplasmic lysates of untreated and silenced WT and dBMSCs, 48 h posttransfection. C and D: Relative protein expression of Nrf2 and Keap1 in cells as indicated. E: Immunofluorescence of Nrf2 and Keap1 in dBMSCs transfected with siNS or siKeap1. Magnification is 20×. F: Flow cytometric analysis of intracellular ROS of indicated cells after Keap1 silencing, using CM-H2DCFDA. G: Percentage of PDGFRα+/Sca-1+ dBMSCs after siKeap1 application. H: Quantification of 8-OHdG adducts, an indicator of ROS-mediated DNA damage. I–K: Quantitative RT-PCR of Nrf2-transcribed genes as indicated. L: Total glutathione in cells. Data represented as mean ± SD; n ≥ 3. *P < 0.05; **P < 0.01. See also Supplementary Figs. 3 and 4.

