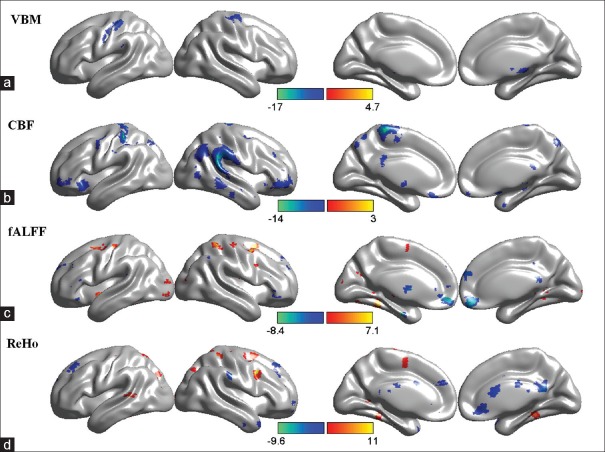
Figure 1.
The comparison of multimodal magnetic resonance imaging metrics between baseline and the 6th month of follow-up. (a) The regions with decreased volume of gray matter at follow-up. (b) The regions with decreased cerebral blood flow at follow-up. (c) The regions with altered functional connectivity, including low-frequency fluctuation at follow-up. (d) The regions with altered regional homogeneity at follow-up. The warm colors indicate increases and the cold colors indicate decreases. The colored bars in a-d represent the t value. P value in a and b was <0.05 with false discovery rate correction, while that in c and d was <0.001 without correction. VBM: Voxel-based morphometry; CBF: Cerebral blood flow; fALFF: Fractional amplitude of low-frequency fluctuation; ReHo: Regional homogeneity.

