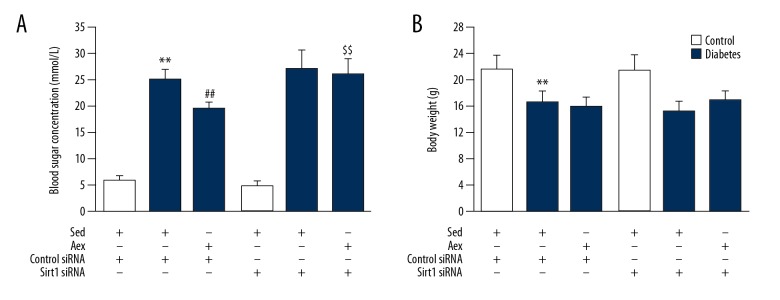
Figure 7.
Effect of Silencing of Sirt1 on blood sugar concentration and body weight in sed-control, sed-diabetes, and aex-diabetes mice. The blood glucose concentration (A) and body weight (B) were measured in sed-control, sed-diabetes, and aex-diabetes mice in control siRNA or Sirt1 siRNA conditions. Bar charts represent means ±SEM (n=7). ** P<0.01 vs. Sed-Control; ## P<0.01 vs. Sed-Diabetes; $$ P<0.01 vs. Aex-Diabetes.

