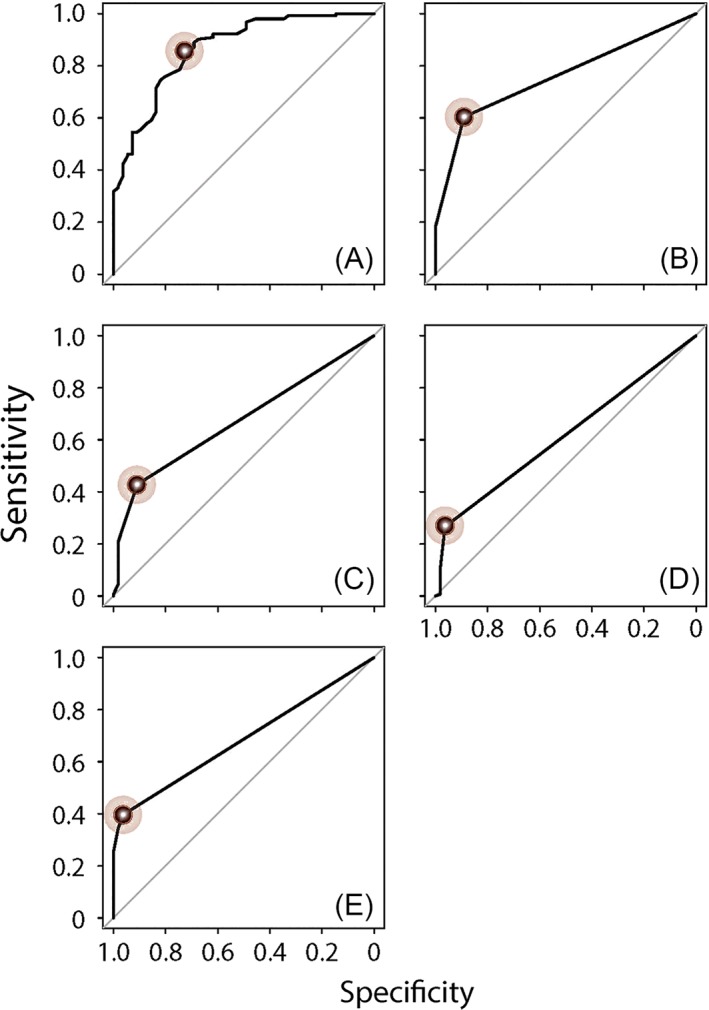
Figure 8.

ROC curves to detect patient‐reported poorly controlled CRS using independent variables of (A) SNOT‐22 score, (B) number of sinus infections in last 3 months, (C) CRS‐related antibiotics courses in last 3 months, (D) CRS‐related oral corticosteroids courses in the last 3 months, and (E) number of missed days of work or school due to CRS in last 3 months. The points reflecting the optimal cut‐off for each statistically significant independent variable, which are summarized in Table 7 and maximized the sum of sensitivity and specificity, are marked in each panel.
