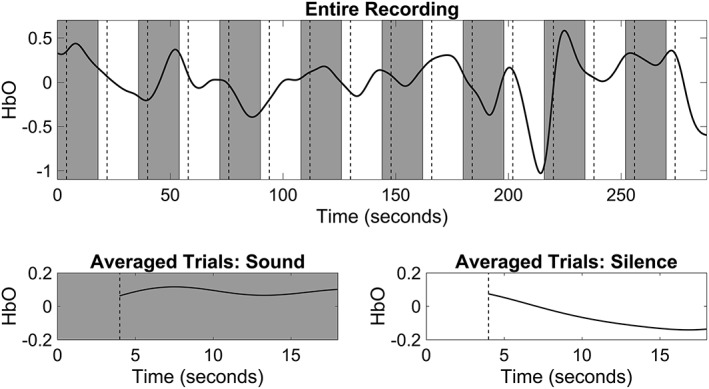
Figure 1.

Example of block design and signal averaging. The top panel contains an example of block design paradigm composed of alternating sound stimuli (gray boxes) and silence (white boxes), with each stimulus lasting 18 seconds. The resulting hemodynamic response of the right auditory cortex is superimposed on the block design schematic. The vertical dashed lines mark 4 seconds after the start of each block, the time required for the hemodynamic response to return to baseline. The bottom panel shows the mean hemodynamic response during the sound blocks (left plot) and silent blocks (right plot) with first 4 seconds of each block excluded from analysis. Note the increased mean activation during the blocks of sound stimulation.
