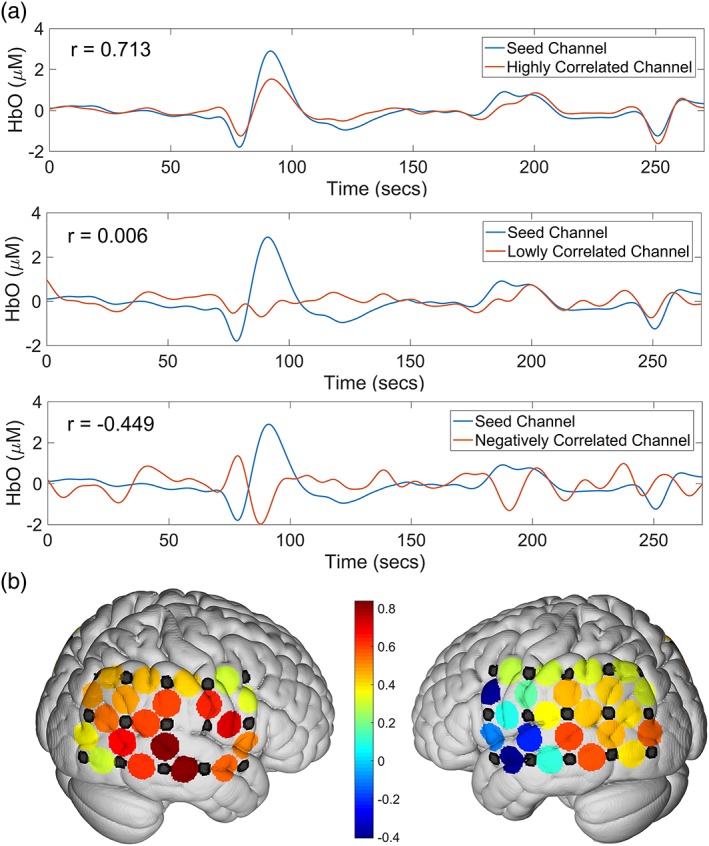
Figure 3.

(a) Demonstration of resting state connectivity differences among various channels. From top to bottom, a channel with high connectivity to the seed region, a channel with negative connectivity to the seed region, and one with low connectivity to the seed region. (b) Heat map of connectivity to the right auditory cortex (channels left blank in the figure). Warmer colors indicate high connectivity to the seed region and cooler colors indicate negative connectivity to the seed region.
