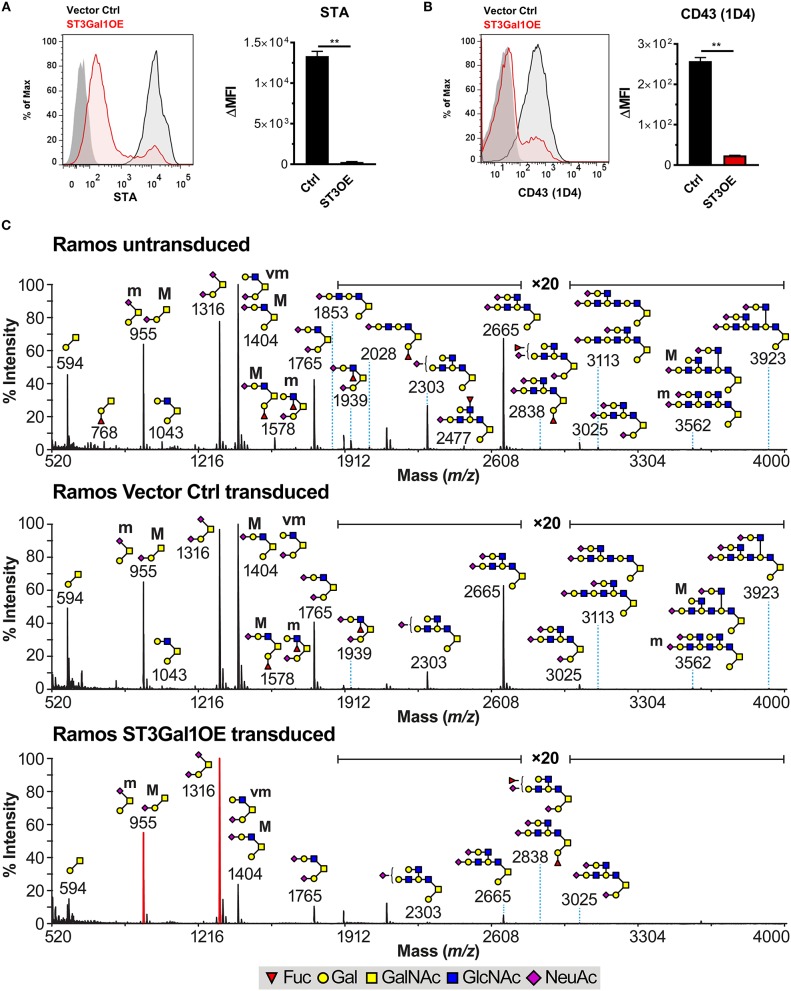
Figure 5.
Overexpression of ST3Gal1 truncates O-glycans in B cells. (A) Representative histograms (left) and quantification (right) of binding of the Core 2 poly-LacNAc binding lectin Solanum tuberosum agglutinin (STA) to vector control and ST3Gal1OE Ramos B cells by flow cytometry. (B) Representative histograms (left) and quantification (right) of binding of the CD43 mAb 1D4 (Core 2 O-glycan-specific glycoform) to vector control and ST3Gal1OE Ramos B cells by flow cytometry. (C) Cellular O-glycome Reporter/Analysis (CORA) of untransduced Ramos, Ramos vector control, and Ramos ST3Gal1OE B cells. Depicted are MALDI-TOF MS spectra of peracetylated Benzyl-α-GalNAc-linked O-glycans. Structures above a bracket have not been unequivocally defined. Indicated areas in the spectra have a 20-fold magnification. “M” and “m” designations indicate major and minor abundances, respectively. Cartoon structures were drawn according to http://www.functionalglycomics.org guidelines and are representative from repeat experiments on two different biological replicates. Structure assignments are based on composition, tandem mass spectrometry, and biosynthetic knowledge. Full methods for MS analysis can be found in Materials and Methods. Data depict results from three (A,B) or two (C) biological replicates. Statistics in (A) and (B) were calculated using Welch's unpaired, two-tailed t-test. Throughout, bars and error bars depict the mean and SEM, respectively. **p ≤ 0.01, ΔMFI, background subtracted geometric mean fluorescence intensity. Ctrl, vector control; ST3OE, ST3Gal1OE; Fuc, fucose; Man, mannose; Gal, galactose; GlcNAc, N-acetylglucosamine; GalNAc, N-acetylgalactosamine; NeuAc, N-acetylneuraminic acid (sialic acid).

