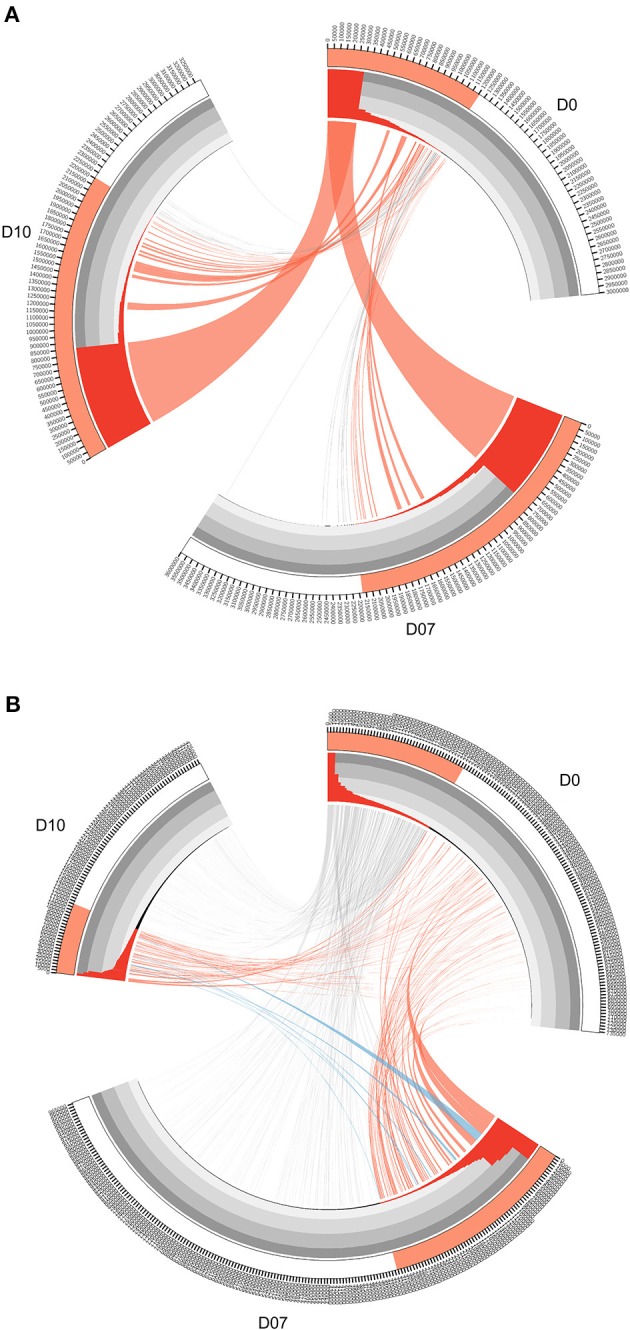
Figure 3.

Circos diagrams of pattern change of TRB clone frequency and IGH lineage frequency during the time course of final boost of rhesus macaques A5R069 from the N51 group. (A) Clones were sorted by their frequency at three different time points, the clone number of each time point is ticked on the outer lane. High abundance clones (>0.01%) are marked in red. The inner histogram lane shows the frequency of each clone with the height of each bar representing the relative abundance. The width of both the histogram and ribbon represents the frequency of each clone. Ribbons connect the same TCR clones at different time points. The ribbons connecting the high abundance clones at D7 and D10 that showed increase in frequency of more than 1-fold compared to D0 were labeled in red, those connecting the clones showing 50% decrease in frequency were labeled in gray, and those connecting the newly emerged clones that have high abundance (>0.01%) were labeled in blue (B). IGH lineages were plotted similarly as in (A), with the exception that red ribbons connecting high abundance lineages (>0.05%) at D7 and D10 that showed increase in frequency by more than 3-fold compared to D0.
